success

6 Things You Need To Be Successful At Data Science

What thing can you take back to your business to implement that will help you? There isn’t one and that is the point. They were successful because they implemented them all. All.

Growing profitability with data in the field.

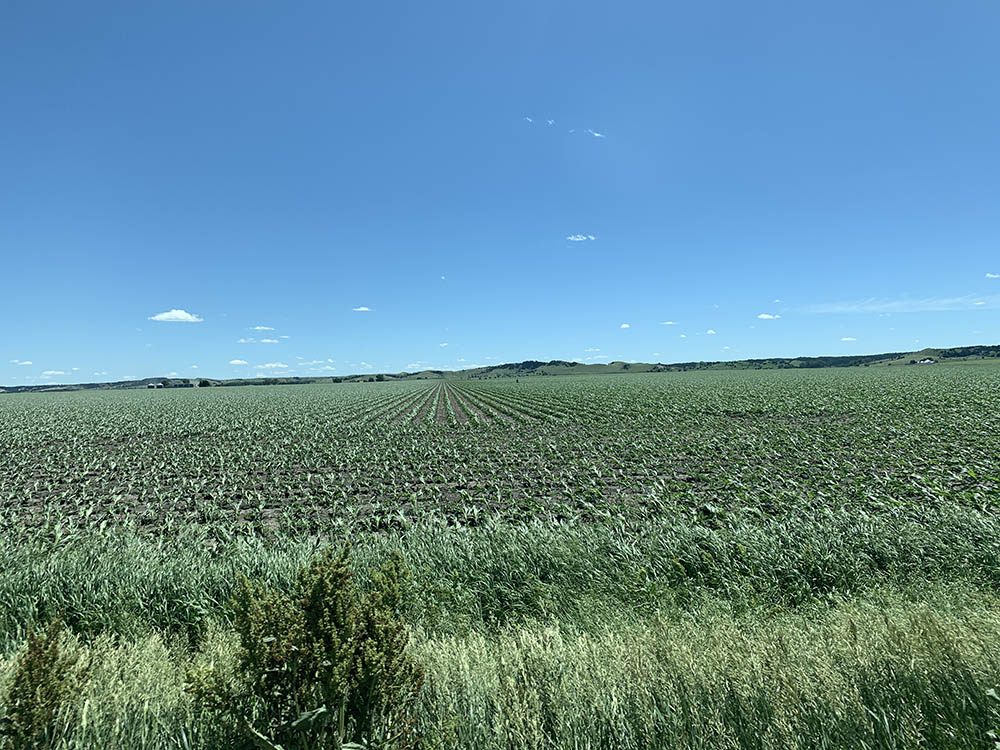
Since human beings began growing crops in a field to establish communities, the mantra has always been “grow more”. Growing more means more food, more stability, and (of course) more money. That money means better equipment, more land, and a means to retire and let the next generation take over. However, one company is showing farmers how to increase profit margins through the use of data.

JC from Crop Tech Solutions in their test field showing how planting depth can aid or hinder the ability of the plant to absorb nutrients. When you lean up your inputs getting every last drop to count is crucial. *Photo taken the morning after heavy rain and 60mph winds

However, with the advent of technology the time honored tradition of growing more took an odd turn. Corn is an industry that measures success in bushels per acre. In chasing more bushels per acre more inputs are needed to push crops to new levels. Farmers may even go bankrupt trying to get a 20% increase in bushels just to better their neighbor or hit a projection.

The advent of technology has changed the paradigm in how crops are cultivated and how they can be grown. Keep in mind, people were still using livestock to plow fields as late as the 1950’s. Now they use ultra precise GPS to navigate a family farm they know like the back of their hands, all for more bushels per acre at harvest time.

John Deere – 1775NT 24 Row 30 Drawn Planter is an example of the level of sophisticated tech in agriculture farmers are pairing with data. This piece of equipment is a far cry from what they used on this ground 50-100 years ago.

With the quest for more bushels comes the additional costs and “inputs”. Inputs can be anything you put into a field to help it grow: water, fertilizer, herbicide, pesticide, and more are all inputs. With deep enough pockets you can fund any number of thousands of variables that go into a particular field. But are those inputs really helping you make more money?

Working Smarter not Harder

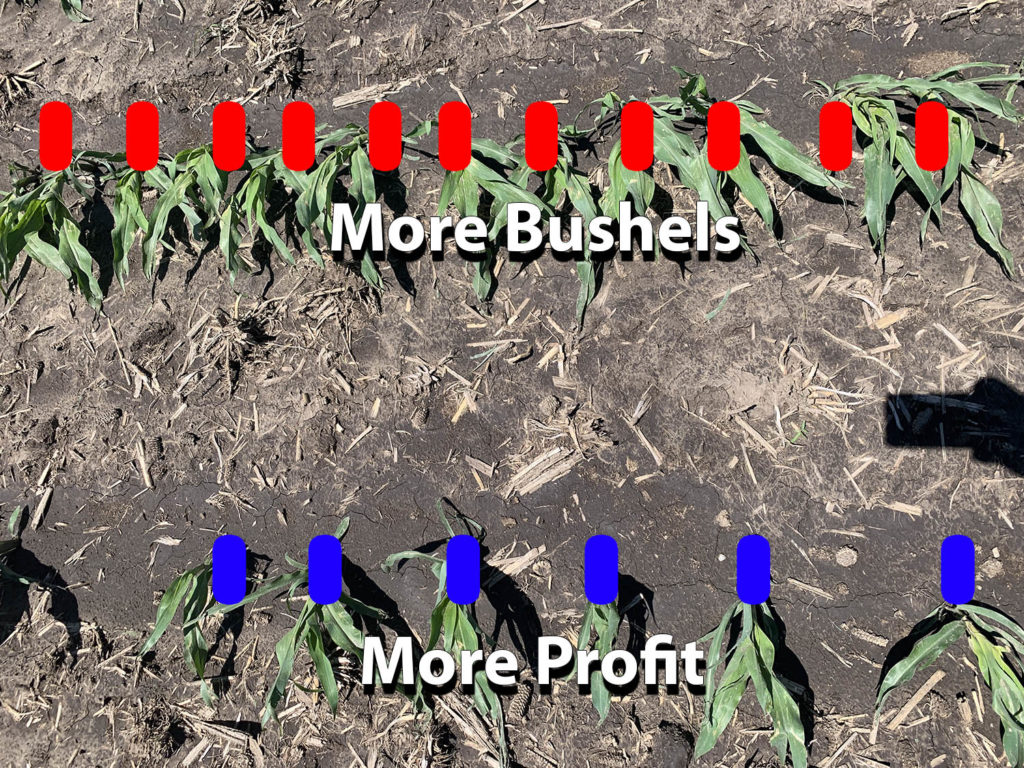
One company, Crop Tech Solutions, realized you can work smarter and not harder. As it turns out being too productive and chasing higher bushel counts can actually be detrimental to your bottom line. Its such a foreign idea let me write that again another way. You can make more money, from less bushels per acre.

JC Smith with Crop Tech Solutions showing the CAN team the difference planting depth can have on plant growth in a test field. *Photo taken the morning after heavy rain and 60mph winds

Seed companies want to sell more seeds, so more seeds means more profit…but for whom? The soil and field conditions will dictate how the corn grows in the field, not the seed count going in. The more you have to add to that field in terms of inputs the more money it will cost to grow it. Each input erodes your profit margin and if its a down year for corn pricing, you’re in the red pretty fast.

“Traditional” field across the road. Plants of different heights, brown spots, bald spots, smaller plants, tighter grouping, higher input levels. *Photo taken the morning after heavy rain and 60mph winds
An optimized field under Crop Tech Solutions watch. Solid green with no brown spots, low spots, or inconsistent growth. *Photo taken the morning after heavy rain and 60mph winds

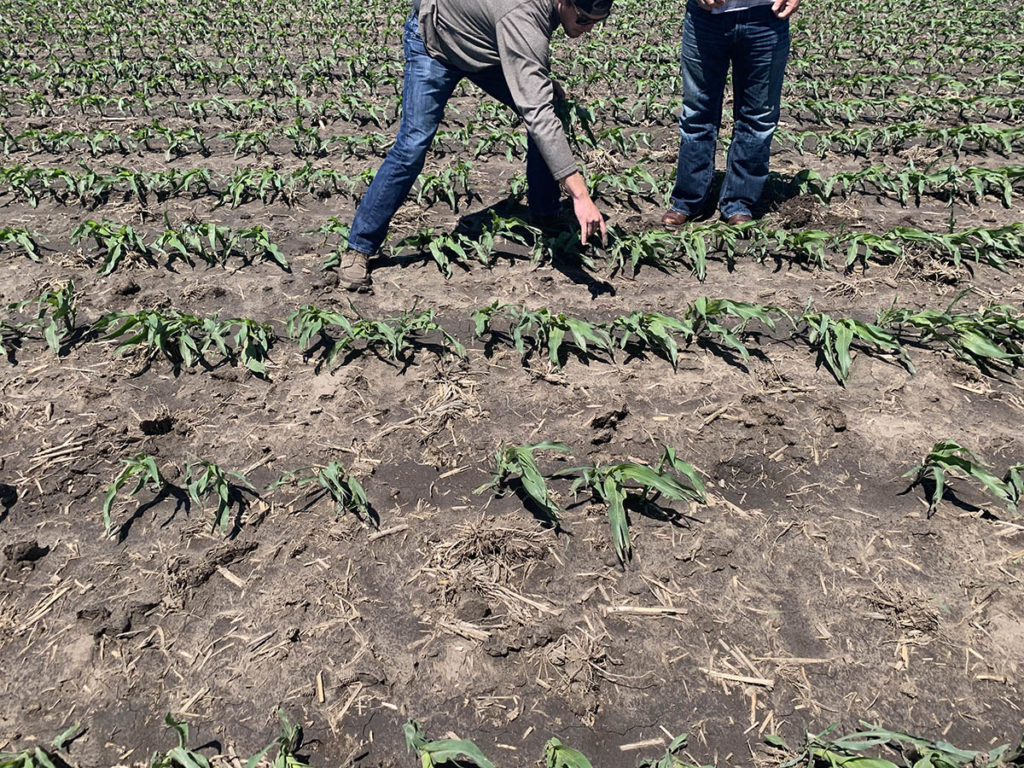
So, somewhat counter intuitively, you can make more money farming with less bushels per acre. By using the data and the technology for precision planting you maximize the potential of the plants without competing for resources. Farming smarter, not harder, the plants can reach a greater potential without competing for resources.

Growing with CAN

Contemporary Analysis has been working with Crop Tech Solutions to get even more from their data. The more effective their data collection and prediction, the easier it is for their customers to see significant gains in profitability. Crop Tech Solutions has been able to help local farmers find Millions in efficiencies, and shows no signs of stopping any time soon.

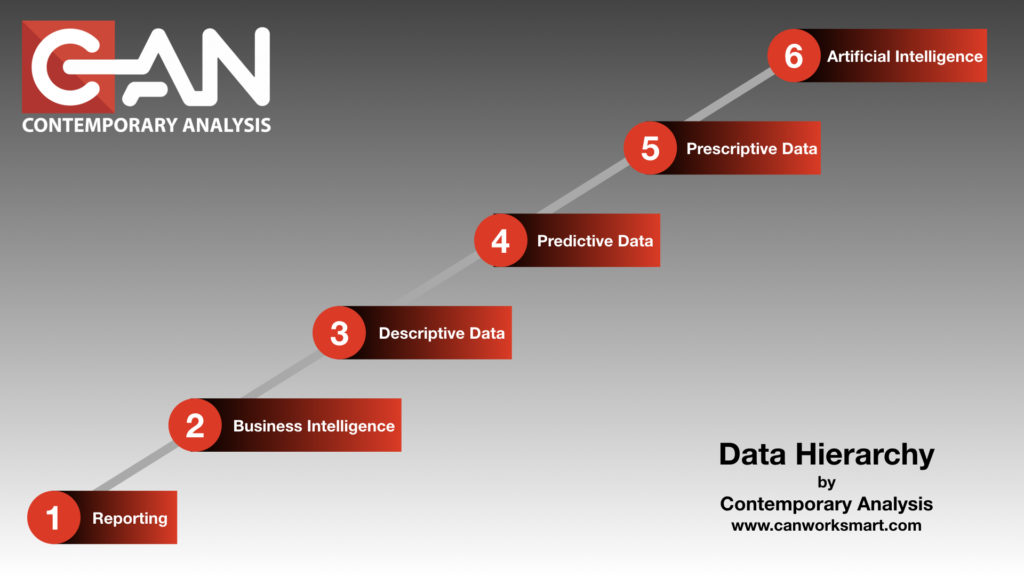
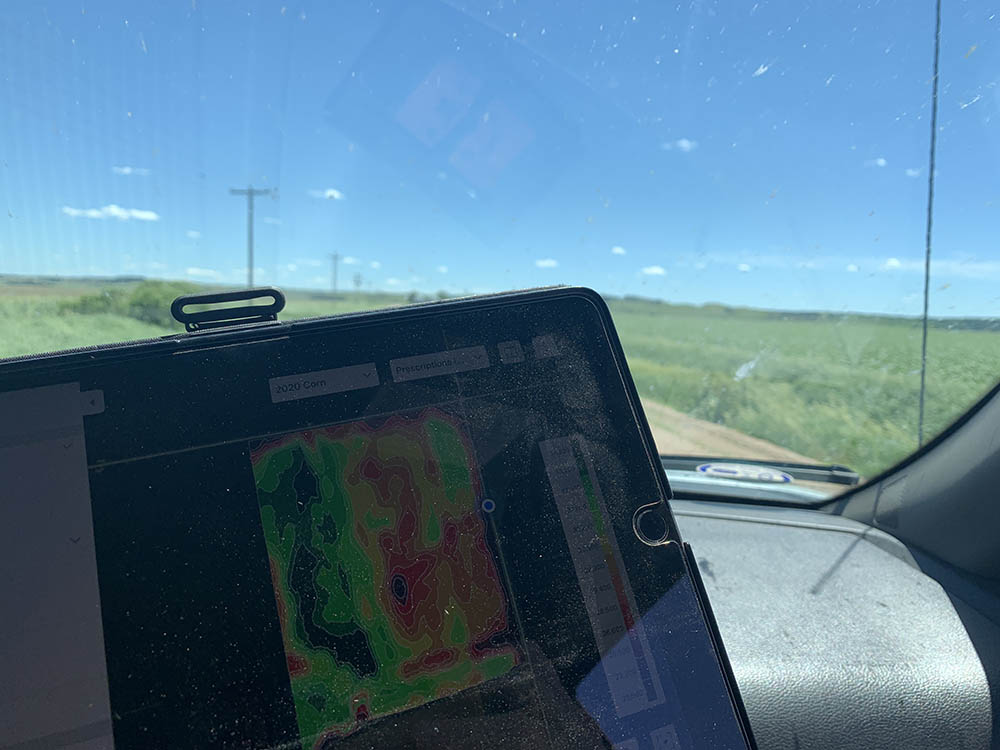
Crop Tech delivers customized prescriptions for each field. Based on the data points from various aspects of farming. As they layer additional data to the process, the more they are able to predict the best combination of field characteristics and inputs. Their prescription helps crops grow to their fullest potential without wasting input dollars trying to push it along.

Example of the data visualization offered from Crop Tech Solutions. The heat map shows how the field was planted and prescribed growth for inputs. When input into precision planting equipment every individual plant has its optimal conditions for growth.

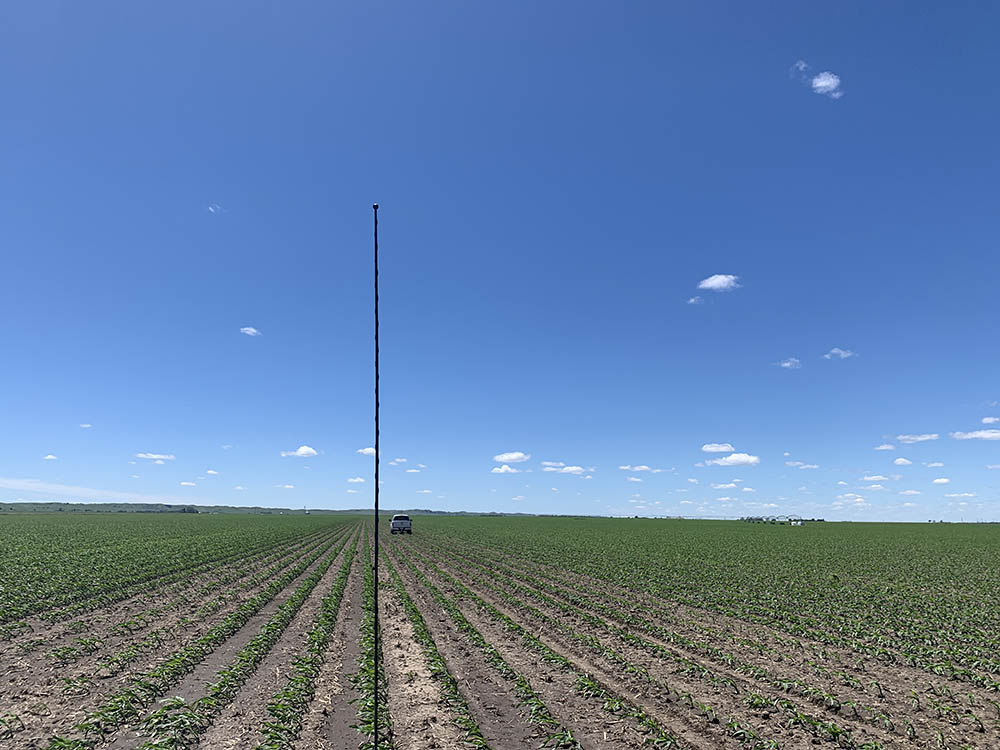
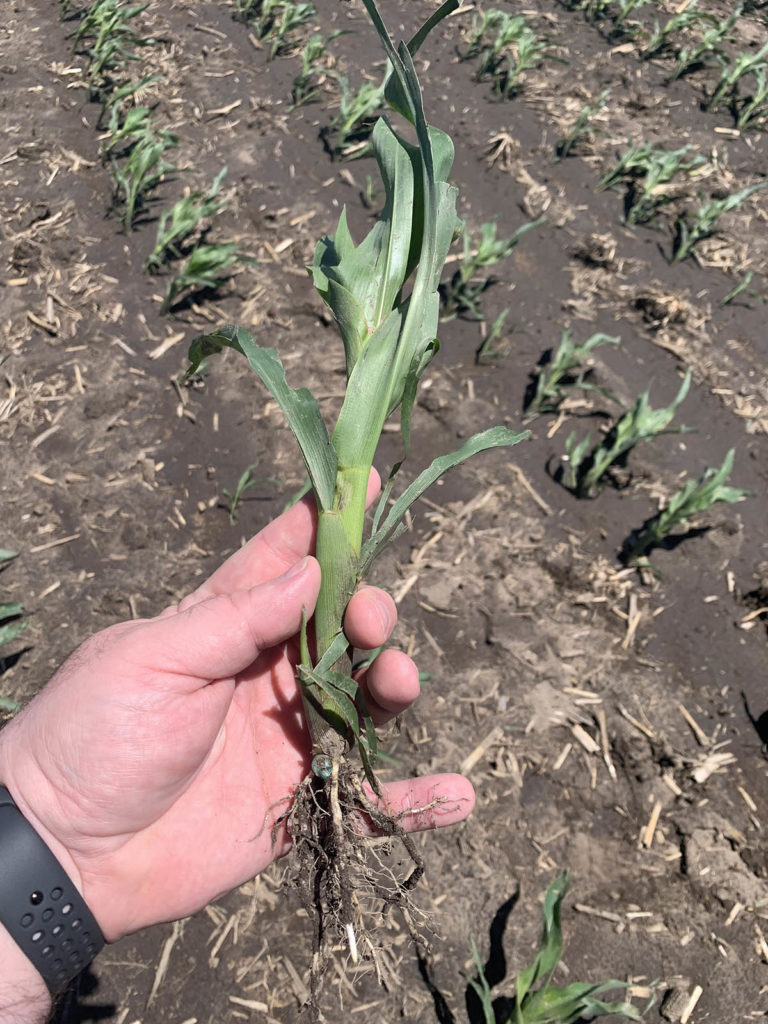
So how do you get more profit from LESS bushels per acre? It all comes down to how much you have to spend to grow the corn. To get 250 bushels per acre you have to purchase chemicals, fertilizer, fuel, and more. These inputs are often in significant quantities to “push” the field to that bushel target. Plants have to compete for resources so they are strained and don’t grow to full potential. Resources like water, sunlight, and root size can dramatically change the way your crops grow.

Working in inches over hundreds of acres can equate to hundreds of thousands of dollars in savings each year. *Photo taken the morning after heavy rain and 60mph winds

When you use the data to understand what the ground can carry, down to the inch in the field, you can optimize every row to get monster corn that isn’t struggling for limited resources. When the corn can grow to its full potential, you don’t have to spend thousands of dollars trying to push it along. The data takes the “gut feeling” out of farming.

Precision agriculture delivers results, but only if you know how to deploy it. You can have the best equipment in the world, but if you don’t set it up right you’re wasting money. The prescription delivered from the layered data points helps program seed planting equipment (for example) accurately. A section of your field may call for a 6 inch gap between plants while another segment, 20 feet away, may call for 1 1/2 inches between plants. The compulsion to “split the difference” and then “set it and forget it” could cost you hundreds of thousands of dollars in the long run. You’re literally betting the farm on how many inches apart you place crops in the field.

JC showing the guys from CAN how the planting types can change from row to row with precision agriculture. This test field shows how plants that are grouped closely together compete for resources. Others that are spaced too far apart aren’t using all the input resources and wasting money in the process. *Photo taken the morning after heavy rain and 60mph winds
Even the depth of the seed being planted can effect the yield per plant. The goal is to understand the variables and how to optimize them for each square food of growing space. *Photo taken the morning after heavy rain and 60mph winds

Very few farmers work on an all cash basis. Each year they take a loan from the bank to fund the operation. These loans can be in the hundreds of thousands or even millions of dollars. The less you can spend on inputs the less you need to borrow. The less you need to borrow, the less you have in interest payments. When you go to sell your crops the fluctuating prices mean the farmer who grew quality crops with lean inputs will see more profit. The farmer who grew to the seed company suggestions has a skinnier margin (if any) and could actually lose money growing corn in a bad year.

The red row is planted to the seed provider spec. The blue row is planted to the field and how it can grow corn most efficient. *Photo taken the morning after heavy rain and 60mph winds

The Payoff

At Contemporary Analysis we love working in what we call the “Steel toe industries”. These areas include, Agriculture, Construction, Manufacturing, Transportation, and Logistics. We carry over lessons learned from our non-steel toe clients and vice versa. The end result is a broad spectrum of options where others may only see one or two.

Our goal is to help companies make better data driven decisions at every turn. In this instance, its helping farmers remain profitable year over year. Because of the champions of data like Crop Tech Solutions we can help keep families and even entire communities thriving through data.

Overall we had a great visit with the guys from Crop Tech Solutions. They even gave us a private tour of the Sod House Museum which is one of their passion projects.

If you’d like to see how we could help you do more with less, contact us.

What does the Post COVID-19 Landscape in business look like?

How will the Post COVID-19 pandemic landscape in business be changed? Are we headed to a future like the Jetsons or one like Mad Max? Companies who once feared remote workers are waking up to the benefits of this work/life balance. Others are in panic mode because “we’ve always done it this way” no longer applies.

As a Data Science company, we are always looking ahead. One thing we get asked about is what should business be doing now to prepare for the world in the new normal. At our first in-person lunch meeting Post COVID-19 pandemic, we came to the conclusion the two book-ends are: Jetsons or Mad Max.”

Here are some of our thoughts:

The Post COVID-19 Business Landscape

We believe the major change is how customers now interact with companies. We have, because of the pandemic shown that companies can actually do just fine working from home, can deliver good like groceries, food, and even luxury items without the in-person experience, and that companies can do a better job using technology to deliver what the customer wants, when the customer wants it.

This is pandora’s box. We can’t go back. Because we had to do this to survive, now we have to continue to do it as part of our business model. However, what most companies built in haste, isn’t scalable. It is now time to rethink how we use the data we have (and the data we can get) to build a scalable solution that gives us insight into what customers want, and gives the customers what they desire–better access.

Interestingly enough, when going back through our past project history, we realize we have been building solutions for just this problem for years. Take for example the persona model we built for Omaha Public Power District (OPPD). It is a great example of how to use data for greater impact.

For OPPD, one of the few publically owned utilities in the entire country, our predictive model allowed them to understand which product or service each household had the highest chance to purchase, and then give that insight to their sales and marketing teams. This meant that:

  1. Their customer service agents now had access to which products to recommend when they called in.
  2. Their sales team knew which households were most likely to want each product, and
  3. Their marketing team knew which product to market to each household.

Predictive modeling like this allows companies to “hit” more than “miss”. If your able to be more effective, even by a small margin, you may edge out your competitor. Tell that to Jacob Kiplimo who was on pace to set the world record for a 43:00 15km run. Kiplimo raised his arms to celebrate before crossing the finish line. It was then that Kibiwott Kandie passed him and finished in 42:59 and was the first to break the record instead.

Understanding how to start with data-driven decisions can be tough. Lucky for you, there is a company that can help you get this kind of insight, and teach you how to do it. Contact Us today and we’ll be happy to help ensure you hit the ground running post-COVID.

Steps in going from BI to Predictive to AI

Data Hierarchy

Machine Learning, Business Intelligence, and Artificial Intelligence are buzz words that are being thrown around at planning sessions a lot these last few years. They have real meanings that most people don’t understand. They are using them to mean “more sophisticated at using data to make decisions”. And while that is right, there is a right way and a very wrong way to lead your company down the path of using data to make data-driven decisions. After 10+ years of helping companies understand what that path is, we wanted to help you the reader understand the order and the real definitions of the buzz words. This way, you can not be educated, but you can give your company the direction it needs to go up the Data Hierarchy.

Data Science is in an integral part of everyday life at this point and you just don’t know it.  As a society, we’re generating more data than ever before. Smart businesses are tapping into that data to do things that were previously unheard of.

Take Facebook for example.  20 years ago Facebook didn’t exist, now people are addicted to it and seemingly can’t live without it.  But even then, people are still weary of the dreaded “Facebook algorithm” that cuts 50% of the posts you might want to see.  That algorithm is data science at work

That’s right, you’ve generated enough data that Facebook wrote some code to cut 50% of your friends out of your life.  You didn’t interact with them enough, they didn’t post enough, there are hundreds of reasons why that system feels like your college roommates buddy from down the hall with the cat doesn’t need to be at the top of your feed.  It also looks at what you read on a regular basis and then tries to predict what you would want to read next.

So to help people truly understand what we do as a company, and to help you hire us.  (let’s be honest) We put together a series on the sophistication of data usage as businesses mature that we call the Business Data Hierarchy.  The goal of this series is to help people and companies understand where they are now, and where they could go with data driven decision making.

We’ve written the series to be informative and insightful, with a splash of humor mixed in to keep you awake through the whole process.  If you like it or if you feel like someone needs to read this…we ask that you share the info or…better yet…get them in touch with us and we’ll bring the show to you!  The pyrotechnic guys tell us we’ll need a 25’ ceiling for the fire and lasers…Hey, it’s a good show.

…this will also be the longest post of the entire series, don’t worry!

When you look at Data, and what it can do for you and your company, there are six different levels of Data Hierarchy.  It’s a hierarchy because each level is codependent on another.

These levels are important to understand because jumping from one to another, without a long term goal, can be cost prohibitive.  This is even more devastating when you finally get your executive level to believe in the power of data, and it breaks the bank in the execution.

“Skipping” leads to “Skippers”

There are consultants with lovely summer and winter homes who have paid for them “skipping” to the end and then back billing/building the solutions.

To insulate against catastrophic failure of a data-driven initiative we at Contemporary Analysis (CAN) have created a Data Hierarchy to help companies understand where they are and more importantly, where they are going. This understanding helps drive the strategy and vision needed to be successful.  These levels are

  1. Reporting:  Tracking and “What happened?”
  2. Business Intelligence:  “What just happened?”
  3. Descriptive Data:  “Why did that happen?”
  4. Predictive Data:  “What is going to happen next?”
  5. Prescriptive Data:  “What should we do to make it happen?”
  6. Artificial Intelligence:  “Automated recommendations”
  7. Omnipotent AI (Skynet): “Automated Doing of its own recommendations” a.k.a. “Terminator Movies”

Every business is trying to move “forward”.  If you work for a company whose response is anything but “forward” or “more” start polishing up your resume, you’ll need it sooner than later.

Most companies are so focused on today’s business they don’t know what the path to the future looks like.  

Imagine you tell a CEO you’re going to walk a mile to get another 1 million in sales.  Most CEO’s would look at the distance and agree that a short distance is worth the time and effort to get the additional revenue.  

The sprint to 1 million

You and your team(s) work feverishly to get from point A to point B as quickly as possible.  You cross the finish line and there’s your 1 million. The CEO checks the box and there it is, project complete.

Now imagine if you told a CEO you’re going to get 20 million in sales.  After the confused look and possible laughing subsides you tell them how.  Instead of a mile, you have to walk 15 miles. But you’re not going to do them all in 1 year.  Instead you’re going to walk that distance over 5-6 years. You’ll measure success with each mile you pass and each mile will result in ROI for the company.

Mountain road in Norway.

You also let them know that you can cover the ground when and how you want to.  If one mile is too tough to work in the time and effort this year, you postpone it to the next.  If, as you’re walking, a business need changes and you need to walk a completely different direction you can.  The steps remain the same but the road you use to get there is slightly different.

Understanding the long term goal allows you and your team(s) the ability to work smarter not harder.  You’re building toward the vision at every turn so you have little to no wasted effort. And, because you’re building over time, you can staff accordingly for each mile and access the right talent at the right time

Part of CAN’s role is being that “Data Visionary” that helps you see over the horizon with possibilities.  The hardest part of this whole process is getting the decision makers in an organization to embrace the culture of change.

“We’ve done it this way for __X__ years and it works just fine.”  Is becoming the leading indicator of a dying business. If you’re 40 years old the technology available today wasn’t even conceptualized when you were in grade school.  “We’ve done it this way for 50 years…” means you’re already behind the curve.

The posts that will follow will walk you through each level of the Business Data Hierarchy concept.  We’ll be sure to include examples that are relatable. The subject matter can be a bit dry, so we’ll also make sure we include some humor along the way to keep things lively.  We’re a Data Science Consulting firm..not monsters after all.

At any point, feel free to reach out and let us know how we can help you through these steps:

Reporting

Business Intelligence

Descriptive Analytics

Predictive Analtyics

Prescriptive Analtyics

Machine Learning

Artificial Intelligence

Omaha Data Science Academy

Omaha Data Science Academy Video

Nate Watson, president of Contemporary Analysis (CAN), talks about the Omaha Data Science Academy (ODSA). The ODSA is Omaha’s first accredited school specific to skills related to Data Science. It was started because we saw a need to help individuals at companies who already had a degree, but needed a few new skill sets to accomplish the tasks given to them by their companies. The ODSA teaches data science programming, database, data visualization, and modeling. Taught by practicing data scientists, a student is going to get real-world knowledge about how to build and implement real, functional, and useable models and visualizations into their companies.

In the real world, the answer isn’t in the back of the book. We will take the time to walk you through the process we know will work, and that we have used hundreds of times to solve some of the hardest problems for some of the largest companies. This includes real-world examples, real-world problems, and real data sets from real projects. This exposure means you get to learn in an actual environment where the answer is rarely perfect. We will also teach you what “good enough” means in data science and why you have to be okay with moving forward with models that could be better. (Good enough is the opposite of perfect. Trying to chase perfection in a model kills more data science in the real world than anything else). Lastly, we will look at how to present and sell data science to the organization. After all, if the organization doesn’t use it, regardless of the potential ROI, your actual ROI will be zero.

In our latest video, we will discuss why having access to the ODSA is important to the community, why skill training from practicing data scientists is important to implementing data science into companies, and the challenges companies face with implementing Data Science.

Nate Watson talking about Omaha Data Science Academy
Data Scientist wants you to invest in data science
Space Nate wants you in our next Cohort!

Want to learn more about the Omaha Data Science Academy?

Click the button below.

how land is used in the US

Good Data Visualization Example: Here’s how America uses its land

Here at Contemporary Analysis, we believe good data visualization is the key to understanding data and making data-driven decisions from it. We have worked with multiple companies (including nonprofits) over the years to provide valuable visualizations of their data, both at the macro and micro levels, to help them use their data more strategically. While technologically agnostic, we do recommend Tableau for those users who are either new or non-technical. We offer classes on how to use data visualization through our school, the Omaha Data Science Academy.
(more…)

Data Science: America's Hottest Job

Data science has been named America’s hottest job by an article written in Bloomberg.
In recent years, there has been an explosion in the amount of available data and an advancement in tools that can tame and harness it. Companies are counting on data scientists to make discoveries within the data, yet there is a major shortage of people who are skilled in this area. The article recounts how this scarcity is causing companies to pay incredibly high wages to attract these sought-after professionals.
 
Programs for aspiring data scientists are difficult to find within traditional institutions because data science has only sprung up in recent years. Nontraditional educational routes such as the Omaha Data Science Academy has tried to fill this gap. Interested in joining the next cohort? Apply now.

Software engineers working on project and programming in company

Python or R – CAN’s Advice on How to Choose

The age-old Python or R debate always rages here at CAN. While we have a pretty impressive staff of data scientists who all have their individual quirks (Some like to run in their spare time, some bird watch, some of them binge-watch obscure sci-fi), they have something in common. They work hard, around the clock if they have to, to accomplish projects, and put their best foot forward for clients.

But, they do differ in one big way. Some use Python and some use R
So, today, we let them debate: Python v. R — which one is for you?

If you’re completely new to the computer programming discussion

Webopedia defines computer programming language as “A vocabulary and set of grammatical rules for instructing a computer to perform specific tasks.” How does one talk to computers? In code. It’s gets tricky, however, because there are a lot of different codes that computers can understand. There are not just 10, 20, or 30 different computer languages that exist. There are hundreds and hundreds of languages. You can browse a full list here. Python and R are just two of the most popular for data science.

For some additional help, we’ve compiled a list of terms that will help you understand the background of this topic (inspired by LinkedIn).

Programmatic thinking. It’s exactly what it sounds like. It’s a way of thinking that you have to turn on when you learn computer programming. It means seeing the large problem as a series of smaller steps. It also requires being able to transcribe ideas into a code that computers understand.
Compiled and interpreted languages. Compiled languages require the user to compile and build code before it can run. Interpreted languages can read code directly without compiling.
API. API stands for application programming interface. Basically, it’s instructions put out by the program designers for accessing the full functions of the language and softwares.
Pseudocode. It’s like code, but not. It’s shorthand for standard code and helps programmers with outlining before they dig into bigger coding tasks.
Armed with a few definitions, let’s jump into the debate.

Python v. R: Where to Start

First, we’re going to hit at the hard truth. In order to succeed in the data science world, you need to be familiar with both languages (or at least good at one and familiar with the other). Particularly in Omaha, where CAN is headquartered and data analyst jobs are highly competitive, knowledge of both languages gives you a leg up on the competition. In fact we have training classes through the Omaha Data Science Academy that teach both. 
But that’s not what you want to hear, we know that. So we’re still going to break the two down and tear them apart in comparison.

Both Python and R are good at . . .

Python and R are both free to download, and the learning curve is about the same once you’ve already mastered some basic programming skills. They’re both impressive to master, so in that way you can’t go wrong. No one will shame you for mastering one and not the other.

Python Positives

Python is know for data munging, data wrangling, website scraping, web app building, and data engineering.
Let’s say you’re tackling a project with a lot of disparate data. Maybe you’re collecting sales data from the past 5 years for a company to help them predict new trends. The problem is that the company has had several turns in management, and that data is stored in multiple locations. Python would be more helpful in this situation. It succeeds as a software for gathering data from many databases and making it one.
If you already know Java or C, Python is going to come more naturally for you. The similarities coincide for your benefit.
It is an object-oriented programming language (see above), so it’s easy to write large scale and robust code. And, some people say there is data to prove that more business owners are looking for those proficient in Python over other languages.

Positives of R

R has better visualization tools than Python. It’s also been around a lot longer, which means there are more online support communities than Python (think: APIs). There are over 5,000 softwares you can find on the internet to run alongside R to boost its capabilities.
R is known for being great at statistical modeling, graphing, and converting math to code.
Perhaps you’re working on a project for a company that has a nice and neat database. The problem is, it’s difficult for most people to look at a bunch of numbers and understand trends. R is the most helpful for these situations, as it can successfully take data and make it into graphs and pictures for others to understand it.

Let’s talk to CAN

In attempt to settle this debate, we’ve brought in some professional opinions.
Matt Hoover, Director of Data Visualization, Flywheel: Matt sees R used as a more efficient math language, emphasis on the word “math”. It can achieve in one line of code what Python needs several lines to accomplish. R’s specialty is research, statistics, and data analysis, so it’s more efficient on the stats side. He continues, “Python is way more flexible as a language overall and can be used to do a wider range of things.” Matt sees R used in more learning settings than on the field, and sees Python used for more high-level data science.
Essentially, R is easier to learn and better on the math/statistics side, but overall Python has more capabilities.
Gordon Summers, Senior Data Scientist, CAN: Gordon’s advice is a bit more far-reaching. He says, “The hardest thing about picking between Python and R isn’t choosing which one to start learning, it is in choosing when it is time to stop learning it”. Basically, Gordon’s advice is to not focus so much on which language to master, but instead realize that something new could come along at any time, so don’t invest too much time in one.

In summation

If you work consistently with clean data, and your goal is to dissect the data and creative visualizations from it, go with R. If you have messy data that you need to “wrangle,” Python is more helpful.
Still stuck? Answer the following questions to help you navigate the Python v. R world.

  • What are your teammates using? Maybe you just got a job in data science and can’t decide which one to learn. Look around – what are you friends and fellow employees using? Are they successful in their work?
  • What are the data trends of you job market? It wouldn’t be inappropriate for you to call up a company who just posted a data science job and ask what they would prefer. Get a feel more the market, decide from there.
  • Whose data are you working with? Is the data messy and needs to be gathered? Python is your answer. Is your data clean and needs to be visualized? Go with R.

You can’t go wrong

Neither Python nor R is perfect. Both will have downfalls, but there are packages that exist to help alleviate those pains. Examples of libraries that can help alleviate problems can be found at https://elitedatascience.com/r-vs-python-for-data-science.
To summarize more thoughts by Gordon Summers, the IT world is changing. He says, “To do development is to use the application and to use the application is to do development. There is no IT person and no business user. The person is both a developer and a business user. One of the reasons that larger organization have struggled to embrace Python and R is that frequently there is an organizational barrier between IT and Business.” When you enter the programming language, data science, or IT world, be ready to be flexible. Businesses are still struggling to figure out where IT fits in their company. The best advice is to be adaptable and to understand where you are going so you can understand the best way to get there.

Oh, and not to complicate the entire argument, but about the time we get the R v Python debate settled, Scala might just come from the back of the pack to win the whole thing. After all, Twitter is in part written in Scala and Hadoop choose to write Spark in Scala.  Social Media Speed and Big Data Prowess? Perhaps this dark horse isn’t the long shot after all.

machine learning prediction

March Machine Learning Mayhem

Machine Learning and the NCAA Men’s Basketball Tournament Methodology

 <<This article is meant to be the technical document following the above article. Please read the following article before continuing.>>

“The past may not be the best predictor of the future, but it is really the only tool we have”

 
Before we delve into the “how” of the methodology, it is important to understand “what” we were going for: A set of characteristics that would indicate that a lower seed would win. We use machine learning to look through a large collection of characteristics and it finds a result set of characteristics that maximizes the number of lower seed wins while simultaneously minimizing lower seed losses. We then apply the result set as a filter to new games. The new games that make it through the filter are predicted as more likely to have the lower seed win. What we have achieved is a set of criteria that are most predictive of a lower seed winning.
 
This result set is fundamentally different than an approach trying to determine the results of all new games whereby an attempt is made to find result set that would apply to all new games. There is a level of complexity and ambiguity with a universal model which is another discussion entirely. By focusing in on one result set (lower seed win) we can get a result that is more predictive than attempting to predict all games.
 
This type of predictive result set has great applications in business. What is the combination of characteristics that best predict a repeat customer? What is the combination of characteristics that best predict a more profitable customer? What is the combination of characteristics that best predict an on time delivery? This is different from just trying to forecast a demand by using a demand signal combined with additional data to help forecast. Think of it as the difference between a stock picker that picks stocks most likely to rise vs. forecasting how far up or down a specific stock will go. The former is key for choosing stocks the later for rating stocks you already own.
 
One of the reasons we chose “lower seed wins” is that there is an opportunity in almost all games played in the NCAA tournament for there to be a data point. There are several games where identical seeds play. Most notably, the first four games do involve identical seeds and the final four can possibly have identical seeds. However, that still gives us roughly 60 or so games a year. The more data we have, the better predictions we get.
 
The second needed item is more characteristics. For our lower seed win we had >200 different characteristics for years 2012-2015. We used the difference between the characteristics of the two teams as the selection. We could have used the absolute characteristics for both teams as well. As the analysis is executed, if a characteristic is un-needed it is ignored. What the ML creates is a combination of characteristics. We call our tool, “Evolutionary Analysis”. It works by adjusting the combinations in an ever improving manner to get result. There is a little more in the logic that allows for other aspects of optimization, but the core of Evolutionary Analysis is finding a result set.
The result set was then used as a filter on 2016 to confirm that the result is predictive. It is possible that the result set from 2012-2015 doesn’t actually predict 2016 results. Our current result set as a filter on 2016 data had 47% underdog wins vs. the overall population. The historic average is 26% lower seed wins and randomly, the 47% underdog win result could happen about 3.4% of the time. Our current result is therefore highly probable as a predictive filter.
 
The last step in the process is to look at those filter criteria that have been chosen and to check to see if they are believable. For example, one of the criteria that was Defensive Efficiency Rank. Evolutionary Analysis chose a lower limit of … well it set a lower limit, let’s just say that. This makes sense, if a lower seed has a defense that is ranked so far inferior to the higher seed, it is unlikely to prevail. A counter example is that the number of blocks per game was not a criteria that was chosen. In fact, most of the >200 criteria were not used, but that handful of around ten criteria set the filter that chooses a population of games that is more likely to contain a lower seed winning.
 
And that is one of the powerful aspects of this type of analysis, you don’t get the one key driver, or even two metrics that have a correlation. You get a whole set of filters that points to a collection of results that deviates from the “normal”.
 
Please join us as we test our result set this year. We’ll see if we get around 47%. Should be interesting!
 
If you have questions on this type of analysis or machine learning in general, please don’t hesitate to contact Gordon Summers of Cabri Group (Gordon.Summers@CabriGroup.com) or Nate Watson at CAN (nate@canworksmart.com).
**Disclaimer: Any handicapping sports odds information contained herein is for entertainment purposes only. Neither CAN nor Cabri Group condone using this information to contravene any law or statute; it’s up to you to determine whether gambling is legal in your jurisdiction. This information is not associated with nor is it endorsed by any professional or collegiate league, association or team. Machine Learning can be done by anyone, but is done best with professional guidance.


Why you should invest in your employees

Investing in employees means more than just treating them well by giving them benefits and a flexible schedule. It means putting time and resources into individuals who have potential for greatness, but may need a little guidance.

More and more companies find it strategic to invest in their employees, even if it means allowing them to move on to greener pastures when the time comes. These companies care about the personal and career growth of their individual employees. They don’t back away from new talent who may need a little training. They see opportunity in new hires, unlike most who are afraid to waste money on training.

One such company is Contemporary Analysis (CAN). CAN provides predictive analytics to businesses with needs to unlock patterns in their data. President Nate Watson committed to investing in employees from the beginning. The result of his investments is the substantive alumni network of CAN.

Alumni networks are the metaphorical badges of honor for companies committed to their employees’ growth. Employees may move on to other businesses or start their own companies, but they continue to maintain positive relationships with companies like CAN who invested so much in their future. Past employees reach out to the network for advice, giving them a makeshift peer network even when they are the only data scientist in their company.

Watson comments, “By investing in our employees’ future, we get people not only willing to go the extra mile for us, but access to employees who have the tenacity to figure out how to solve problems. We lose really good talent, but a lot of the contracts we have right now are from companies that have our former employees in them.”

The opening comic portrays the decision to invest in employees perfectly: CFO: “What if we train them and they leave?” CEO: “What if we don’t…and they stay?” Companies like CAN know that whether employees stay or leave, resources are not wasted.

CAN doesn’t wait for the most highly trained analysts to walk through the door. CAN nurtures potential with patience for greatness.

Some companies make the switch to investing in their employees years after they begin operations. For CAN, commitment to training employees is embedded in their DNA.

Nine years ago, the same people who rely on data analysis to keep their companies moving today had never even thought of hiring a data analyst. This was during the recession. As a result, a lot of creative people with experience in data science were out of work.

Grant Stanley is the former CEO of CAN. Stanley saw the small pool of highly driven, intelligent, but under employed people as something special–something with which he could start a company.  

He then built CAN, the now 9 year old predictive analytics company. Stanley and his non-traditional co-workers would approach companies like Mutual of Omaha or West and say, “Give us the hardest problem you have and let us have a crack at solving it.” Many times they would get an opportunity because a solution was already tried by the “regulars” and failed. Giving CAN a chance provided no risk and very little outlay of cash.

Stanley is now CEO of Bric, a software company originally designed for small companies that now helps Fortune 500 companies plan and project manage using predictive analytics.

CAN approached the solution differently even from day one. Many times it felt like crash a course in learning the models necessary to succeed. However, CAN’s employees were already good at learning. They looked for solutions, sometimes in other verticals and industries, and applied that knowledge back to the original problem.

They found success even though they were younger and less funded than some of their well known competition. This problem solving ideology has become a cornerstone of how CAN does business, even to this day.

After years of solving difficult problem after difficult problem, the young data scientists were well trained. They now had resumes to qualify for more prestigious positions, even CEO or management positions. CAN learned to cope with employees moving on. They started an alumni network to capture the excitement of the “graduation” of the employees. The alumni network now boasts 15 former employees in 13 companies.

Nate Watson maintains the same mindset of investing in employees for CAN today.

If you look at CAN now, Watson has changed very little. Yes, CAN today has more resources and more consistent work, but their motto still reflects their passion to make businesses better: “Empower the great to build something greater.” This is not only true for how they work with clients, but also how they treat their employees. They aren’t afraid to smile and wave goodbye as their best employees seek other opportunities. That’s why they have such a strong alumni network.

In fact, last month CAN announced the start of the Omaha Data Science Academy (ODSA), the ultimate goal of which is to train and place a data scientists in every company in Omaha. Their goal is not to replace the four year degree, but provide training for those who need an extra push before they become entry-level data scientists.The DSA’s motto of “Building Smarter Talent” likens back to Watson and CAN’s original mantra. 

Further on down the road, of course, there will be an alumni network for the Data Science Academy. Watson comments, “We want each cohort to be able to connect every cohort as they move between companies and up in each company. Having that peer network is going to be key to the success of graduates.”

Watson hopes that the ODSA will inspire even more businesses to invest in their employees.

–The ODSA’s Alpha class starts September 19th–the graduation party, already RSVP’d by some of the most forward thinking companies in the surrounding area, will be on December 8th.

CAN isn’t the only business with an impressive alumni network. Strong alumni networks like CAN’s, however, do seem unique to the tech world.

Aron Filbert at Lyconic is proof of this. Lyconic provides software designed to improve security guard management. Lyconic’s products are proven to increase accountability and decrease turnover rates among guards. 

Filbert needed a talented software developer to create Lyconic. However, he knew that he could not compete with the corporate world in pay. He gave his employees other perks to make up for this, like casual dress, time off, a lax work schedule, fluidity in moving up at Lyconic, and so on.

These other perks, in particular Filbert’s commitment to train and grow with his employees, helped Lyconic build a strong alumni network. Filbert’s greatest success story is a man named Carl Zulauf. He worked for Lyconic for a little over one year, gaining valuable experience alongside Filbert.

He moved on to a start-up company in New York City where he was compensated very well.

Filbert speaks of Zulauf with pride, not resentment. This is what makes Lyconic and CAN’s alumni network unique to growing tech world: they believe in each other, and that leads to success for everyone. Most businesses only care about the success of their company, not the growth of individuals.

Three significant results of having an alumni network.

Companies use their alumni networks in different ways. Since the beginning, CAN noted three positive and long-lasting results for their alumni network.

The physical result: CAN’s alumni network includes some of the biggest names in Omaha as well as some of the most promising startups. Names like HDR, Avantas, TD Ameritrade, Kiewit, Flywheel, and even Ebay are sporting former CAN employees. As well as 4 founders of data science software companies: Eric Burns at GazellaWifi, Luis Lopez at Crumb, Grant Stanley at Bric, and James Rolfsen at Kojuba. With each movement out, a vacancy occurs that can be filled is filled by new employees that need only training and an opportunity.

The social impact: The alumni network is an active and working peer connection hub. Former employees of CAN left on positive terms which means they still keep in touch and occasionally ask for help on projects or advice on business moves. The reverse is true as well: CAN doesn’t hesitate to reach out to the alumni network with questions and advice.

The emotional fulfillment: As Watson continues to invest in his employees and sees other companies like Lyconic do the same, he feels a deep sense of pride for the community CAN helped build.

As more and more companies make the switch to investing in employees, what does the future of business look like?

Investing in employees allows companies to retain the value of each individual, even after they are gone. As more businesses decide that money spent on staff training is money well spent, their pool of resources grows beyond their own company. Their former employees continue to have value in an alumni network. In a sense, by investing in employees you never really have to cut the cord when they move on from your business. This doesn’t get rid of competitiveness between companies completely, but it does allow different businesses to act as support for each other’s growth.

Watson of CAN ends with this note, “Investing in people will always be my personal mantra. I hope it continues to permeates the atmosphere of CAN, the ODSA, and the Data Science Community long after I’m gone.”

You learn. You move up. You let go. You come back and talk shop. You train someone else. You maintain connections and continue to encourage each other. That’s CAN. That’s the ODSA. That Lyconic. That’s all companies committed to individual achievement. That’s the beauty of investing in employees.

Featured Posts – Click the Brain
Archives
CAN Jewels