How will the Post COVID-19 pandemic landscape in business be changed? Are we headed to a future like the Jetsons or one like Mad Max? Companies who once feared remote workers are waking up to the benefits of this work/life balance. Others are in panic mode because “we’ve always done it this way” no longer applies.
As a Data Science company, we are always looking ahead. One thing we get asked about is what should business be doing now to prepare for the world in the new normal. At our first in-person lunch meeting Post COVID-19 pandemic, we came to the conclusion the two book-ends are: Jetsons or Mad Max.”
We believe the major change is how customers now interact with companies. We have, because of the pandemic shown that companies can actually do just fine working from home, can deliver good like groceries, food, and even luxury items without the in-person experience, and that companies can do a better job using technology to deliver what the customer wants, when the customer wants it.
This is pandora’s box. We can’t go back. Because we had to do this to survive, now we have to continue to do it as part of our business model. However, what most companies built in haste, isn’t scalable. It is now time to rethink how we use the data we have (and the data we can get) to build a scalable solution that gives us insight into what customers want, and gives the customers what they desire–better access.
Interestingly enough, when going back through our past project history, we realize we have been building solutions for just this problem for years. Take for example the persona model we built for Omaha Public Power District (OPPD). It is a great example of how to use data for greater impact.
For OPPD, one of the few publically owned utilities in the entire country, our predictive model allowed them to understand which product or service each household had the highest chance to purchase, and then give that insight to their sales and marketing teams. This meant that:
Their customer service agents now had access to which products to recommend when they called in.
Their sales team knew which households were most likely to want each product, and
Their marketing team knew which product to market to each household.
Predictive modeling like this allows companies to “hit” more than “miss”. If your able to be more effective, even by a small margin, you may edge out your competitor. Tell that to Jacob Kiplimo who was on pace to set the world record for a 43:00 15km run. Kiplimo raised his arms to celebrate before crossing the finish line. It was then that Kibiwott Kandie passed him and finished in 42:59 and was the first to break the record instead.
Understanding how to start with data-driven decisions can be tough. Lucky for you, there is a company that can help you get this kind of insight, and teach you how to do it. Contact Us today and we’ll be happy to help ensure you hit the ground running post-COVID.
Machine Learning, Business Intelligence, and Artificial Intelligence are buzz words that are being thrown around at planning sessions a lot these last few years. They have real meanings that most people don’t understand. They are using them to mean “more sophisticated at using data to make decisions”. And while that is right, there is a right way and a very wrong way to lead your company down the path of using data to make data-driven decisions. After 10+ years of helping companies understand what that path is, we wanted to help you the reader understand the order and the real definitions of the buzz words. This way, you can not be educated, but you can give your company the direction it needs to go up the Data Hierarchy.
Data Science is in an integral part of everyday life at this point and you just don’t know it. As a society, we’re generating more data than ever before. Smart businesses are tapping into that data to do things that were previously unheard of.
Take Facebook for example. 20 years ago Facebook didn’t exist, now people are addicted to it and seemingly can’t live without it. But even then, people are still weary of the dreaded “Facebook algorithm” that cuts 50% of the posts you might want to see. That algorithm is data science at work
That’s right, you’ve generated enough data that Facebook wrote some code to cut 50% of your friends out of your life. You didn’t interact with them enough, they didn’t post enough, there are hundreds of reasons why that system feels like your college roommates buddy from down the hall with the cat doesn’t need to be at the top of your feed. It also looks at what you read on a regular basis and then tries to predict what you would want to read next.
So to help people truly understand what we do as a company, and to help you hire us. (let’s be honest) We put together a series on the sophistication of data usage as businesses mature that we call the Business Data Hierarchy. The goal of this series is to help people and companies understand where they are now, and where they could go with data driven decision making.
We’ve written the series to be informative and insightful, with a splash of humor mixed in to keep you awake through the whole process. If you like it or if you feel like someone needs to read this…we ask that you share the info or…better yet…get them in touch with us and we’ll bring the show to you! The pyrotechnic guys tell us we’ll need a 25’ ceiling for the fire and lasers…Hey, it’s a good show.
…this will also be the longest post of the entire series, don’t worry!
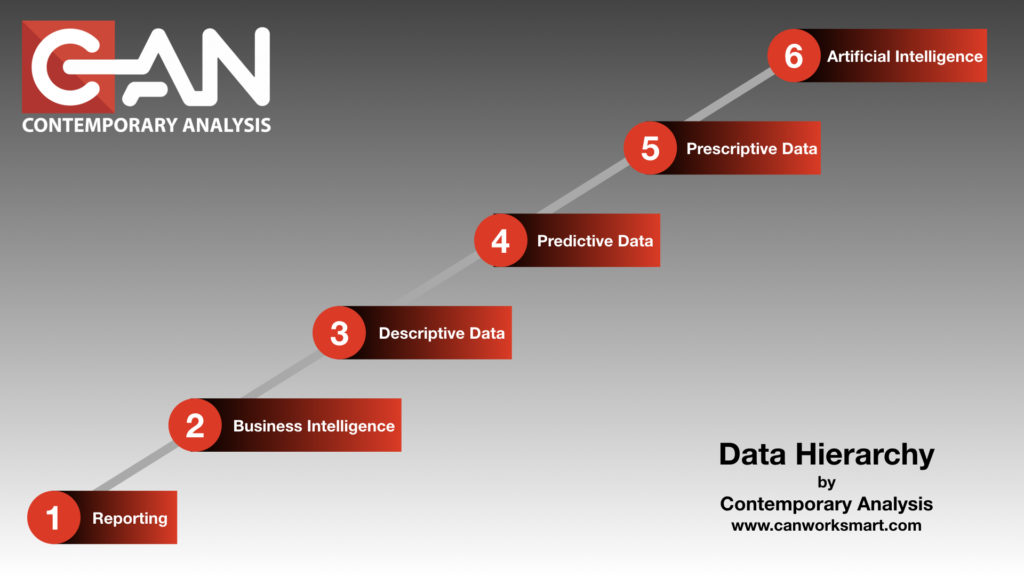
When you look at Data, and what it can do for you and your company, there are six different levels of Data Hierarchy. It’s a hierarchy because each level is codependent on another.
These levels are important to understand because jumping from one to another, without a long term goal, can be cost prohibitive. This is even more devastating when you finally get your executive level to believe in the power of data, and it breaks the bank in the execution.
“Skipping” leads to “Skippers”
There are consultants with lovely summer and winter homes who have paid for them “skipping” to the end and then back billing/building the solutions.
To insulate against catastrophic failure of a data-driven initiative we at Contemporary Analysis (CAN) have created a Data Hierarchy to help companies understand where they are and more importantly, where they are going. This understanding helps drive the strategy and vision needed to be successful. These levels are
Omnipotent AI (Skynet): “Automated Doing of its own recommendations” a.k.a. “Terminator Movies”
Every business is trying to move “forward”. If you work for a company whose response is anything but “forward” or “more” start polishing up your resume, you’ll need it sooner than later.
Most companies are so focused on today’s business they don’t know what the path to the future looks like.
Imagine you tell a CEO you’re going to walk a mile to get another 1 million in sales. Most CEO’s would look at the distance and agree that a short distance is worth the time and effort to get the additional revenue.
The sprint to 1 million
You and your team(s) work feverishly to get from point A to point B as quickly as possible. You cross the finish line and there’s your 1 million. The CEO checks the box and there it is, project complete.
Now imagine if you told a CEO you’re going to get 20 million in sales. After the confused look and possible laughing subsides you tell them how. Instead of a mile, you have to walk 15 miles. But you’re not going to do them all in 1 year. Instead you’re going to walk that distance over 5-6 years. You’ll measure success with each mile you pass and each mile will result in ROI for the company.
Mountain road in Norway.
You also let them know that you can cover the ground when and how you want to. If one mile is too tough to work in the time and effort this year, you postpone it to the next. If, as you’re walking, a business need changes and you need to walk a completely different direction you can. The steps remain the same but the road you use to get there is slightly different.
Understanding the long term goal allows you and your team(s) the ability to work smarter not harder. You’re building toward the vision at every turn so you have little to no wasted effort. And, because you’re building over time, you can staff accordingly for each mile and access the right talent at the right time
Part of CAN’s role is being that “Data Visionary” that helps you see over the horizon with possibilities. The hardest part of this whole process is getting the decision makers in an organization to embrace the culture of change.
“We’ve done it this way for __X__ years and it works just fine.” Is becoming the leading indicator of a dying business. If you’re 40 years old the technology available today wasn’t even conceptualized when you were in grade school. “We’ve done it this way for 50 years…” means you’re already behind the curve.
The posts that will follow will walk you through each level of the Business Data Hierarchy concept. We’ll be sure to include examples that are relatable. The subject matter can be a bit dry, so we’ll also make sure we include some humor along the way to keep things lively. We’re a Data Science Consulting firm..not monsters after all.
At any point, feel free to reach out and let us know how we can help you through these steps:
Machine Learning and the NCAA Men’s Basketball Tournament Methodology
<<This article is meant to be the technical document following the above article. Please read the following article before continuing.>>
“The past may not be the best predictor of the future, but it is really the only tool we have”
Before we delve into the “how” of the methodology, it is important to understand “what” we were going for: A set of characteristics that would indicate that a lower seed would win. We use machine learning to look through a large collection of characteristics and it finds a result set of characteristics that maximizes the number of lower seed wins while simultaneously minimizing lower seed losses. We then apply the result set as a filter to new games. The new games that make it through the filter are predicted as more likely to have the lower seed win. What we have achieved is a set of criteria that are most predictive of a lower seed winning.
This result set is fundamentally different than an approach trying to determine the results of all new games whereby an attempt is made to find result set that would apply to all new games. There is a level of complexity and ambiguity with a universal model which is another discussion entirely. By focusing in on one result set (lower seed win) we can get a result that is more predictive than attempting to predict all games.
This type of predictive result set has great applications in business. What is the combination of characteristics that best predict a repeat customer? What is the combination of characteristics that best predict a more profitable customer? What is the combination of characteristics that best predict an on time delivery? This is different from just trying to forecast a demand by using a demand signal combined with additional data to help forecast. Think of it as the difference between a stock picker that picks stocks most likely to rise vs. forecasting how far up or down a specific stock will go. The former is key for choosing stocks the later for rating stocks you already own.
One of the reasons we chose “lower seed wins” is that there is an opportunity in almost all games played in the NCAA tournament for there to be a data point. There are several games where identical seeds play. Most notably, the first four games do involve identical seeds and the final four can possibly have identical seeds. However, that still gives us roughly 60 or so games a year. The more data we have, the better predictions we get.
The second needed item is more characteristics. For our lower seed win we had >200 different characteristics for years 2012-2015. We used the difference between the characteristics of the two teams as the selection. We could have used the absolute characteristics for both teams as well. As the analysis is executed, if a characteristic is un-needed it is ignored. What the ML creates is a combination of characteristics. We call our tool, “Evolutionary Analysis”. It works by adjusting the combinations in an ever improving manner to get result. There is a little more in the logic that allows for other aspects of optimization, but the core of Evolutionary Analysis is finding a result set. The result set was then used as a filter on 2016 to confirm that the result is predictive. It is possible that the result set from 2012-2015 doesn’t actually predict 2016 results. Our current result set as a filter on 2016 data had 47% underdog wins vs. the overall population. The historic average is 26% lower seed wins and randomly, the 47% underdog win result could happen about 3.4% of the time. Our current result is therefore highly probable as a predictive filter.
The last step in the process is to look at those filter criteria that have been chosen and to check to see if they are believable. For example, one of the criteria that was Defensive Efficiency Rank. Evolutionary Analysis chose a lower limit of … well it set a lower limit, let’s just say that. This makes sense, if a lower seed has a defense that is ranked so far inferior to the higher seed, it is unlikely to prevail. A counter example is that the number of blocks per game was not a criteria that was chosen. In fact, most of the >200 criteria were not used, but that handful of around ten criteria set the filter that chooses a population of games that is more likely to contain a lower seed winning.
And that is one of the powerful aspects of this type of analysis, you don’t get the one key driver, or even two metrics that have a correlation. You get a whole set of filters that points to a collection of results that deviates from the “normal”.
Please join us as we test our result set this year. We’ll see if we get around 47%. Should be interesting!
If you have questions on this type of analysis or machine learning in general, please don’t hesitate to contact Gordon Summers of Cabri Group (Gordon.Summers@CabriGroup.com) or Nate Watson at CAN (nate@canworksmart.com). **Disclaimer: Any handicapping sports odds information contained herein is for entertainment purposes only. Neither CAN nor Cabri Group condone using this information to contravene any law or statute; it’s up to you to determine whether gambling is legal in your jurisdiction. This information is not associated with nor is it endorsed by any professional or collegiate league, association or team. Machine Learning can be done by anyone, but is done best with professional guidance.
We get asked quite frequently: Why should my company invest in predictive analytics? Why even bother? What can it do for us?
Great questions. Predictive Analytics, or predictive analysis, used to be a competitive advantage. All through the first part of the 2010s, companies used data science, predictive analytics, and machine learning to take their business intelligence (knowing what is happening inside the company right now) and turning it into what is going to happen in the future so we can plan for it before it happens. We call this moving up the data hierarchy. But somewhere in the middle of 2019, we saw a switch. As CAN took companies through our process to get them data-driven decision making, we realized companies weren’t using it for their competitive advantage anymore, they are using it to stay relevant.
Companies now are required to do more with less. They are required to stay relevant to their customers. They are required to know who their customers are and what they want-all before the customer does. Data intelligence is now so common in our lives, companies have to implement predictive analytics to even stay with (not ahead) of their customers.
Example: With technology developing so quickly, new ways to implement marketing strategies and more effectively reach consumers are popping up all the time. Predictive analytics is one such technique. Praised for its ability to inform companies of future trends and reveal important information, predictive analytics is growing in popularity, with 87 percent of B2B marketing leaders saying they had already implemented or were planning to implement predictive analytics in the coming 12 months.
So what is it? What is predictive analytics and how do you use it.
What Is Predictive Analytics?
Before fleshing out its benefits, it’s probably best to first explain what predictive analytics is. Predictive analytics is a process for collecting and analyzing current data using Business Intelligence, Machine Learning, and potentially AI.
How Can Predictive analytics Benefit Marketing and Sales?
More Efficient Customer Acquisition
By providing your sales team with specific data, predictive analytics can allow them to acquire new customers and keep old ones more efficiently and with less cost. What journey do they take to purchase a product? What advertising do they respond to? What is it about your product/service that they enjoy the most? All these questions can be answered by analyzing previous data and drawing conclusions about future activity. This information can then be used to determine which customers to reach out and how best to appeal to them, saving time and money.
Determine Up-sell Opportunities
Predictive analytics also assists in drawing conclusions about other aspects of your customers’ buying behavior. Through analytics, brands can better understand what their customers’ needs are and what exactly they’re looking for. This can then be used to tailor the sales and marketing strategy to specific customers. For example, if you are a fashion brand and have customers who are in need of shoes, it would be inefficient and wasteful to send them an advertisement for a new shoe promotion. Instead, it would be better to send this to customers in need of footwear to maximize on profit.
Optimize Marketing Strategy
Not only can predictive analytics benefit brands by helping to find information on customers, it can also help in regards to the market environment. You can learn what time of the year spending peaks, how much people are spending and what they’re spending their money on. This information can assist in the successful execution of marketing strategies by ensuring you are targeting the right people at the right time. Or you can figure out where to score the most candy on Halloween as we did back in 2013 when we invented a dashboard to help trick-or-treaters. See, predictive analytics can be fun too.
Predictive analytics is an increasingly popular method for brands to more effectively initiate sales and marketing strategies. By providing detailed information about market trends and buying behavior, brands can cut costs, boost profit and increase overall efficiency.
There is something very strange about Contemporary Analysis. It’s not something that can be easily identified or quantified. People have often remarked on the fact that we are different even though they weren’t able to put their finger on what exactly made us different.
Perhaps you’ve noticed. On any given day, a person might wander into our offices and overhear a conversation about artificial intelligence, or a spirited debate over metabolic intelligence versus programmable intelligence. Often, the ideas that capture our attention haven’t yet entered into the imaginations of the public at large. Sometimes we tend to discuss the trends of the future as if they’ve already happened, and it’s these types of clues that have aroused suspicion. And so, we have decided to come clean and confess.
We are from the future.
We’ll forgive you if this claim is met with skepticism, after all, the first rule of time travel is that you just don’t talk about the future. But we’re not interested in following that rule, we want to talk about the future. There are a few things we think you should know.
We want you to know that in the future, things aren’t so bad. In most ways the future looks surprisingly similar to the present. The major difference is that “the new” is neither good nor bad. People will be creating all sorts of new things in the years to come, just like we always have. You do not need to be scared of “the new.” There will always be new ways of thinking, fueled by new ideas. There will be new problems but also new solutions.
At CAN we were raised in this bold, new world. It’s what we’ve always known. We grew up with computers, the internet and a plethora of digital interface devices at our fingertips. We navigate these new landscapes with relative ease and radical speed.
Predictive Analytics is the future. The future is now. How will you use it?
After writing my previous post, “How Often Should You Update Predictive Models”, it was appropriate to followup with a post regarding the consequences of not updating predictive models.
Predictive models use the patterns in historical and transactional data to identify risks and opportunities. Since the conditions and the environment are constantly changing the accuracy of predictive models need to be monitored. Once a predictive model no longer reflects reality it needs to be updated. Most of the time this is because the assumptions behind the model need to be updated.
Take for example a community bank. Internally every new transaction, deposit, withdrawal, application, or transfer creates new data. For most individuals, these transactions are occur several time every day, and that means you’re compiling thousands of new data points. Over time the customers environment is changes, this is reflected in each data point collected. Did they get a raise or a new job? Is there car breaking down? So although this community bank may have a relatively modest customer base, their customers are experiencing change all the time.
Also, their are external changes that impact a customer’s behavior. For example interest rates change, new competitors enter markets, competitors invest in marketing, consumer confidence changes, and competitors merge. It makes sense then that they would need to update their predictive models to keep up with all of these changes. When these changes start to represent structural changes a new model needs to be developed.
For a typical community bank, strategic sales, marketing, and planning decisions happen at least once a quarter. If a bank doesn’t update their predictive models in preparation for these events, they are at a high risk of using obsolete information when making decisions.
What are the consequences of using this obsolete information?
Your pricing models don’t reflect changes in the competitive environment.
You recommend outdated products.
Your marketing material isn’t targeted at the right groups. They might not exist any more.
Your business development team begins chasing the wrong types of leads. For example, it might not be a profit environment to pursue new home mortgages.
So if you’re planning on making an investment in predictive analytics, make sure you consider the implications of using your data as well as the consequences of using outdated information.
Everyday new information is being created in your business. Your customers are buying more, subscribing or unsubscribing, and before you know it your customers today are seemingly different than the customer you had the day before.
As these new patterns emerage its important to periodically take time to investigate your data, update your predictive models, and challenge the assumptions about your business going forward. But how often should you do this? To answer that question, consider the following:
How often is my data changing?
How often do I plan on making decisions with the data?
Many people credit the rise of predictive analytics to the technological advances of the last 50 years. However, The history of predictive analytics starts in 1689. Its true that record keeping standards, relational databases, faster CPUs, and even newer technologies such as Hadoop and MapReduce have made predictive analytics an accessible tool for decision making. However, the history of predictive analytics show that it has been used for centuries. (more…)
Its common to see predictive analytics as a sort of “crystal ball” for your business. This crystal ball image makes for great marketing. Unfortunately, predictive analytics is not a crystal ball.
It will not provide the correct prediction every time. Its primary purpose is to help you make better decisions by giving you the power to unlock the patterns inside your data. When performed correctly this gives you the ability to simplify decisions. When performed incorrectly it can spell disaster for your company.
Predictive analytics is both an art and science. It requires a combination of both empirical and subjective experience to verify that models reflect reality. This is why CAN takes into consideration three main aspects when building predictive models: Data, Theory, and Math. In our experience your predictive models will not reflect reality if all of three of these aspects are not held up. (more…)
There have always been two major ways to expand your business: Grow it, or Buy it. This brings up some interesting questions about which is more beneficial. The correct answer is usually based on cost of customer acquisition and customer lifetime value. Right now, with the cost of client acquisition being so high, companies are turning to buying distressed businesses. One, it eliminates competition, and two, the customers can be acquired “on sale”. While mergers and acquisitions are common across all industries, there seems to be a significant propensity for growth by buying in the banking industry.
The unique problem that is causing an increase in the ” buy them” thought process is that in banking their revenue generating power has dwindled with the decline of interest rates. Not only that but as clients leave for competitors by natural attrition, there is a dire need for new customers. Buying seems to solve both of these.
While it may solve the issue of new customers at a reduced cost, how to transfer the old customer base to the new bank has always been a major problem. First, you have a bevy of new customers who have not gone through your buying process. You have no idea who they are and why they are in the product they are in. Secondly, you can fix problem number one by keeping the staff from the bought bank, but they’re not sure if the customers are in the correct products anymore either because they don’t know what products they have to sell. (more…)