Steps in going from BI to Predictive to AI

Data Hierarchy

Machine Learning, Business Intelligence, and Artificial Intelligence are buzz words that are being thrown around at planning sessions a lot these last few years. They have real meanings that most people don’t understand. They are using them to mean “more sophisticated at using data to make decisions”. And while that is right, there is a right way and a very wrong way to lead your company down the path of using data to make data-driven decisions. After 10+ years of helping companies understand what that path is, we wanted to help you the reader understand the order and the real definitions of the buzz words. This way, you can not be educated, but you can give your company the direction it needs to go up the Data Hierarchy.

Data Science is in an integral part of everyday life at this point and you just don’t know it.  As a society, we’re generating more data than ever before. Smart businesses are tapping into that data to do things that were previously unheard of.

Take Facebook for example.  20 years ago Facebook didn’t exist, now people are addicted to it and seemingly can’t live without it.  But even then, people are still weary of the dreaded “Facebook algorithm” that cuts 50% of the posts you might want to see.  That algorithm is data science at work

That’s right, you’ve generated enough data that Facebook wrote some code to cut 50% of your friends out of your life.  You didn’t interact with them enough, they didn’t post enough, there are hundreds of reasons why that system feels like your college roommates buddy from down the hall with the cat doesn’t need to be at the top of your feed.  It also looks at what you read on a regular basis and then tries to predict what you would want to read next.

So to help people truly understand what we do as a company, and to help you hire us.  (let’s be honest) We put together a series on the sophistication of data usage as businesses mature that we call the Business Data Hierarchy.  The goal of this series is to help people and companies understand where they are now, and where they could go with data driven decision making.

We’ve written the series to be informative and insightful, with a splash of humor mixed in to keep you awake through the whole process.  If you like it or if you feel like someone needs to read this…we ask that you share the info or…better yet…get them in touch with us and we’ll bring the show to you!  The pyrotechnic guys tell us we’ll need a 25’ ceiling for the fire and lasers…Hey, it’s a good show.

…this will also be the longest post of the entire series, don’t worry!

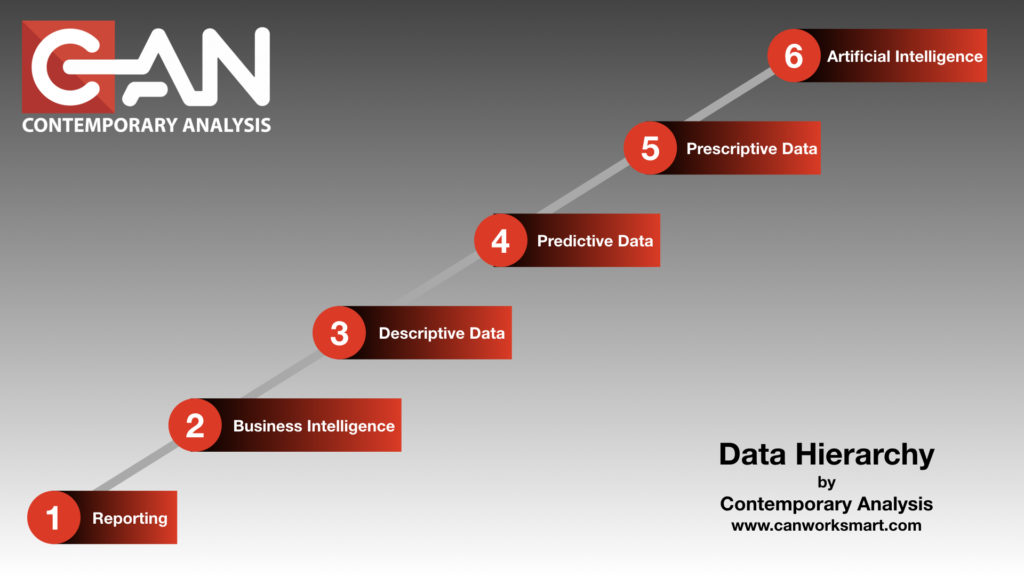
When you look at Data, and what it can do for you and your company, there are six different levels of Data Hierarchy.  It’s a hierarchy because each level is codependent on another.

These levels are important to understand because jumping from one to another, without a long term goal, can be cost prohibitive.  This is even more devastating when you finally get your executive level to believe in the power of data, and it breaks the bank in the execution.

“Skipping” leads to “Skippers”

There are consultants with lovely summer and winter homes who have paid for them “skipping” to the end and then back billing/building the solutions.

To insulate against catastrophic failure of a data-driven initiative we at Contemporary Analysis (CAN) have created a Data Hierarchy to help companies understand where they are and more importantly, where they are going. This understanding helps drive the strategy and vision needed to be successful.  These levels are

  1. Reporting:  Tracking and “What happened?”
  2. Business Intelligence:  “What just happened?”
  3. Descriptive Data:  “Why did that happen?”
  4. Predictive Data:  “What is going to happen next?”
  5. Prescriptive Data:  “What should we do to make it happen?”
  6. Artificial Intelligence:  “Automated recommendations”
  7. Omnipotent AI (Skynet): “Automated Doing of its own recommendations” a.k.a. “Terminator Movies”

Every business is trying to move “forward”.  If you work for a company whose response is anything but “forward” or “more” start polishing up your resume, you’ll need it sooner than later.

Most companies are so focused on today’s business they don’t know what the path to the future looks like.  

Imagine you tell a CEO you’re going to walk a mile to get another 1 million in sales.  Most CEO’s would look at the distance and agree that a short distance is worth the time and effort to get the additional revenue.  

The sprint to 1 million

You and your team(s) work feverishly to get from point A to point B as quickly as possible.  You cross the finish line and there’s your 1 million. The CEO checks the box and there it is, project complete.

Now imagine if you told a CEO you’re going to get 20 million in sales.  After the confused look and possible laughing subsides you tell them how.  Instead of a mile, you have to walk 15 miles. But you’re not going to do them all in 1 year.  Instead you’re going to walk that distance over 5-6 years. You’ll measure success with each mile you pass and each mile will result in ROI for the company.

Mountain road in Norway.

You also let them know that you can cover the ground when and how you want to.  If one mile is too tough to work in the time and effort this year, you postpone it to the next.  If, as you’re walking, a business need changes and you need to walk a completely different direction you can.  The steps remain the same but the road you use to get there is slightly different.

Understanding the long term goal allows you and your team(s) the ability to work smarter not harder.  You’re building toward the vision at every turn so you have little to no wasted effort. And, because you’re building over time, you can staff accordingly for each mile and access the right talent at the right time

Part of CAN’s role is being that “Data Visionary” that helps you see over the horizon with possibilities.  The hardest part of this whole process is getting the decision makers in an organization to embrace the culture of change.

“We’ve done it this way for __X__ years and it works just fine.”  Is becoming the leading indicator of a dying business. If you’re 40 years old the technology available today wasn’t even conceptualized when you were in grade school.  “We’ve done it this way for 50 years…” means you’re already behind the curve.

The posts that will follow will walk you through each level of the Business Data Hierarchy concept.  We’ll be sure to include examples that are relatable. The subject matter can be a bit dry, so we’ll also make sure we include some humor along the way to keep things lively.  We’re a Data Science Consulting firm..not monsters after all.

At any point, feel free to reach out and let us know how we can help you through these steps:

Reporting

Business Intelligence

Descriptive Analytics

Predictive Analtyics

Prescriptive Analtyics

Machine Learning

Artificial Intelligence

Software engineers working on project and programming in company

Python or R – CAN’s Advice on How to Choose

The age-old Python or R debate always rages here at CAN. While we have a pretty impressive staff of data scientists who all have their individual quirks (Some like to run in their spare time, some bird watch, some of them binge-watch obscure sci-fi), they have something in common. They work hard, around the clock if they have to, to accomplish projects, and put their best foot forward for clients.

But, they do differ in one big way. Some use Python and some use R
So, today, we let them debate: Python v. R — which one is for you?

If you’re completely new to the computer programming discussion

Webopedia defines computer programming language as “A vocabulary and set of grammatical rules for instructing a computer to perform specific tasks.” How does one talk to computers? In code. It’s gets tricky, however, because there are a lot of different codes that computers can understand. There are not just 10, 20, or 30 different computer languages that exist. There are hundreds and hundreds of languages. You can browse a full list here. Python and R are just two of the most popular for data science.

For some additional help, we’ve compiled a list of terms that will help you understand the background of this topic (inspired by LinkedIn).

Programmatic thinking. It’s exactly what it sounds like. It’s a way of thinking that you have to turn on when you learn computer programming. It means seeing the large problem as a series of smaller steps. It also requires being able to transcribe ideas into a code that computers understand.
Compiled and interpreted languages. Compiled languages require the user to compile and build code before it can run. Interpreted languages can read code directly without compiling.
API. API stands for application programming interface. Basically, it’s instructions put out by the program designers for accessing the full functions of the language and softwares.
Pseudocode. It’s like code, but not. It’s shorthand for standard code and helps programmers with outlining before they dig into bigger coding tasks.
Armed with a few definitions, let’s jump into the debate.

Python v. R: Where to Start

First, we’re going to hit at the hard truth. In order to succeed in the data science world, you need to be familiar with both languages (or at least good at one and familiar with the other). Particularly in Omaha, where CAN is headquartered and data analyst jobs are highly competitive, knowledge of both languages gives you a leg up on the competition. In fact we have training classes through the Omaha Data Science Academy that teach both. 
But that’s not what you want to hear, we know that. So we’re still going to break the two down and tear them apart in comparison.

Both Python and R are good at . . .

Python and R are both free to download, and the learning curve is about the same once you’ve already mastered some basic programming skills. They’re both impressive to master, so in that way you can’t go wrong. No one will shame you for mastering one and not the other.

Python Positives

Python is know for data munging, data wrangling, website scraping, web app building, and data engineering.
Let’s say you’re tackling a project with a lot of disparate data. Maybe you’re collecting sales data from the past 5 years for a company to help them predict new trends. The problem is that the company has had several turns in management, and that data is stored in multiple locations. Python would be more helpful in this situation. It succeeds as a software for gathering data from many databases and making it one.
If you already know Java or C, Python is going to come more naturally for you. The similarities coincide for your benefit.
It is an object-oriented programming language (see above), so it’s easy to write large scale and robust code. And, some people say there is data to prove that more business owners are looking for those proficient in Python over other languages.

Positives of R

R has better visualization tools than Python. It’s also been around a lot longer, which means there are more online support communities than Python (think: APIs). There are over 5,000 softwares you can find on the internet to run alongside R to boost its capabilities.
R is known for being great at statistical modeling, graphing, and converting math to code.
Perhaps you’re working on a project for a company that has a nice and neat database. The problem is, it’s difficult for most people to look at a bunch of numbers and understand trends. R is the most helpful for these situations, as it can successfully take data and make it into graphs and pictures for others to understand it.

Let’s talk to CAN

In attempt to settle this debate, we’ve brought in some professional opinions.
Matt Hoover, Director of Data Visualization, Flywheel: Matt sees R used as a more efficient math language, emphasis on the word “math”. It can achieve in one line of code what Python needs several lines to accomplish. R’s specialty is research, statistics, and data analysis, so it’s more efficient on the stats side. He continues, “Python is way more flexible as a language overall and can be used to do a wider range of things.” Matt sees R used in more learning settings than on the field, and sees Python used for more high-level data science.
Essentially, R is easier to learn and better on the math/statistics side, but overall Python has more capabilities.
Gordon Summers, Senior Data Scientist, CAN: Gordon’s advice is a bit more far-reaching. He says, “The hardest thing about picking between Python and R isn’t choosing which one to start learning, it is in choosing when it is time to stop learning it”. Basically, Gordon’s advice is to not focus so much on which language to master, but instead realize that something new could come along at any time, so don’t invest too much time in one.

In summation

If you work consistently with clean data, and your goal is to dissect the data and creative visualizations from it, go with R. If you have messy data that you need to “wrangle,” Python is more helpful.
Still stuck? Answer the following questions to help you navigate the Python v. R world.

  • What are your teammates using? Maybe you just got a job in data science and can’t decide which one to learn. Look around – what are you friends and fellow employees using? Are they successful in their work?
  • What are the data trends of you job market? It wouldn’t be inappropriate for you to call up a company who just posted a data science job and ask what they would prefer. Get a feel more the market, decide from there.
  • Whose data are you working with? Is the data messy and needs to be gathered? Python is your answer. Is your data clean and needs to be visualized? Go with R.

You can’t go wrong

Neither Python nor R is perfect. Both will have downfalls, but there are packages that exist to help alleviate those pains. Examples of libraries that can help alleviate problems can be found at https://elitedatascience.com/r-vs-python-for-data-science.
To summarize more thoughts by Gordon Summers, the IT world is changing. He says, “To do development is to use the application and to use the application is to do development. There is no IT person and no business user. The person is both a developer and a business user. One of the reasons that larger organization have struggled to embrace Python and R is that frequently there is an organizational barrier between IT and Business.” When you enter the programming language, data science, or IT world, be ready to be flexible. Businesses are still struggling to figure out where IT fits in their company. The best advice is to be adaptable and to understand where you are going so you can understand the best way to get there.

Oh, and not to complicate the entire argument, but about the time we get the R v Python debate settled, Scala might just come from the back of the pack to win the whole thing. After all, Twitter is in part written in Scala and Hadoop choose to write Spark in Scala.  Social Media Speed and Big Data Prowess? Perhaps this dark horse isn’t the long shot after all.

2017 NCAA Tournament Round of 64 Upset Predictions

The Cabri Group / CAN Machine Learning Lower Seed Win Prediction tool has made its first round forecast! Without further ado:

East Tennessee St. (13) over Florida (4)
Xavier (11) over Maryland (6)
Vermont (13) over Purdue (4)
Florida Gulf Coast (14) over Florida St. (3)
Nevada (12) over Iowa St. (5)
Rhode Island (11) over Creighton (6)
Wichita St. (10) over Dayton (7)

 
* If the last play in games add another predicted upset, we’ll update that prior to the game starting.

Update: USC (11) over SMU (6)

One of the obvious observations on the predictions is: “Wait, no 8/9 upsets????” Remember these games show the most similar characteristics of the largest historic collection of upsets. This doesn’t mean that there will be no upsets as 8/9 nor that all of the predictions above will hit (remember we are going for 47% upsets) nor that all games not listed will have the favorites win. The games on the list are there because they share the most characteristics with historic times when the lower seed won.
Also, one of the key team members on this project, Matt, is a big Creighton fan (and grad). He was not happy to see Creighton on the list. I’ll speak to that one specifically. In the technical notes, I indicated that one of the many criteria that is being used is was Defensive Efficiency (DE). Machine Learning algorithm (Evolutionary Analysis) doesn’t like it when the lower seed has a large gap of DE between the lower seed and the higher seed. Creighton actually has a lower Defensive Efficiency than Rhode Island. Sorry Matt. Again, it doesn’t mean Creighton won’t win, it only means that the Rhode Island v. Creighton game shares more criteria with a the largest collection of historic upsets than the other games in the tournament.
As we indicated, we will use the odds as well as a count of upsets to determine how well we do as the tournament goes on. We’ll have a new set of predictions on Saturday for the next round of the tournament and a recap coming on Monday.
For more information about how we created the Machine Learning algorithm and how we are keeping score, you may read the Machine Learning article here:
http://can2013.wpengine.com/machine-learning-basketball-methodology

machine learning prediction

March Machine Learning Mayhem

Machine Learning and the NCAA Men’s Basketball Tournament Methodology

 <<This article is meant to be the technical document following the above article. Please read the following article before continuing.>>

“The past may not be the best predictor of the future, but it is really the only tool we have”

 
Before we delve into the “how” of the methodology, it is important to understand “what” we were going for: A set of characteristics that would indicate that a lower seed would win. We use machine learning to look through a large collection of characteristics and it finds a result set of characteristics that maximizes the number of lower seed wins while simultaneously minimizing lower seed losses. We then apply the result set as a filter to new games. The new games that make it through the filter are predicted as more likely to have the lower seed win. What we have achieved is a set of criteria that are most predictive of a lower seed winning.
 
This result set is fundamentally different than an approach trying to determine the results of all new games whereby an attempt is made to find result set that would apply to all new games. There is a level of complexity and ambiguity with a universal model which is another discussion entirely. By focusing in on one result set (lower seed win) we can get a result that is more predictive than attempting to predict all games.
 
This type of predictive result set has great applications in business. What is the combination of characteristics that best predict a repeat customer? What is the combination of characteristics that best predict a more profitable customer? What is the combination of characteristics that best predict an on time delivery? This is different from just trying to forecast a demand by using a demand signal combined with additional data to help forecast. Think of it as the difference between a stock picker that picks stocks most likely to rise vs. forecasting how far up or down a specific stock will go. The former is key for choosing stocks the later for rating stocks you already own.
 
One of the reasons we chose “lower seed wins” is that there is an opportunity in almost all games played in the NCAA tournament for there to be a data point. There are several games where identical seeds play. Most notably, the first four games do involve identical seeds and the final four can possibly have identical seeds. However, that still gives us roughly 60 or so games a year. The more data we have, the better predictions we get.
 
The second needed item is more characteristics. For our lower seed win we had >200 different characteristics for years 2012-2015. We used the difference between the characteristics of the two teams as the selection. We could have used the absolute characteristics for both teams as well. As the analysis is executed, if a characteristic is un-needed it is ignored. What the ML creates is a combination of characteristics. We call our tool, “Evolutionary Analysis”. It works by adjusting the combinations in an ever improving manner to get result. There is a little more in the logic that allows for other aspects of optimization, but the core of Evolutionary Analysis is finding a result set.
The result set was then used as a filter on 2016 to confirm that the result is predictive. It is possible that the result set from 2012-2015 doesn’t actually predict 2016 results. Our current result set as a filter on 2016 data had 47% underdog wins vs. the overall population. The historic average is 26% lower seed wins and randomly, the 47% underdog win result could happen about 3.4% of the time. Our current result is therefore highly probable as a predictive filter.
 
The last step in the process is to look at those filter criteria that have been chosen and to check to see if they are believable. For example, one of the criteria that was Defensive Efficiency Rank. Evolutionary Analysis chose a lower limit of … well it set a lower limit, let’s just say that. This makes sense, if a lower seed has a defense that is ranked so far inferior to the higher seed, it is unlikely to prevail. A counter example is that the number of blocks per game was not a criteria that was chosen. In fact, most of the >200 criteria were not used, but that handful of around ten criteria set the filter that chooses a population of games that is more likely to contain a lower seed winning.
 
And that is one of the powerful aspects of this type of analysis, you don’t get the one key driver, or even two metrics that have a correlation. You get a whole set of filters that points to a collection of results that deviates from the “normal”.
 
Please join us as we test our result set this year. We’ll see if we get around 47%. Should be interesting!
 
If you have questions on this type of analysis or machine learning in general, please don’t hesitate to contact Gordon Summers of Cabri Group (Gordon.Summers@CabriGroup.com) or Nate Watson at CAN (nate@canworksmart.com).
**Disclaimer: Any handicapping sports odds information contained herein is for entertainment purposes only. Neither CAN nor Cabri Group condone using this information to contravene any law or statute; it’s up to you to determine whether gambling is legal in your jurisdiction. This information is not associated with nor is it endorsed by any professional or collegiate league, association or team. Machine Learning can be done by anyone, but is done best with professional guidance.


Predicting the upsets for the NCAA Men’s Basketball Tournament using machine learning

Contemporary Analysis (CAN) and Cabri Group and have teamed up to use Machine Learning to predict the upsets for the NCAA Men’s Basketball Tournament. By demonstrating the power of ML through our results, we believe more people can give direction to their ML projects.
 
Machine Learning (ML) is a powerful technology and many companies rightly guess that they need to begin to leverage ML. Because there are so few successful ML people and projects to learn from, there is a gap between desire and direction. 
 
We will be publishing a selection of games in the 2017 NCAA Men’s Basketball Tournament. Our prediction tool estimates games where the lower seed has a better than average chance of winning against the higher seed. We will predict about 16 games from various rounds of the tournament. The historical baseline for lower seeds winning is 26%. Our current model predicted 16 upsets for the 2016 tournament. We were correct in 7 of them (47%), which in simulated gambling gave the simulated gambler an ROI was 10% (because of the odds). Our target for the 2017 tournament will be to get 48% right.
 
Remember, our analysis isn’t to support gambling, but to prove the ability of ML. However, we will be keeping score with virtual dollars. We will be “betting” on the lower seed to win. We aren’t taking into consideration the odds in our decisions, only using them to help score our results.
 
We will be publishing our first games on Wednesday 15th after the first four games are played. We won’t have any selections for the first four games as they are played by teams with identical seeds. Prior to each round, we will publish all games that our tool thinks have the best chance of the lower seed winning. We’ll also publish weekly re-caps with comments on how well our predictions are doing.
 
Understand the technique that finds a group of winners (or losers) in NCAA data can be used on any metric. Our goal is to open up people’s minds onto the possibilities of leveraging Machine Learning for their businesses. If we can predict things as seemingly complex as a basketball tournament (Something that has never been correctly predicted), then imagine what we could do with your data that drives your decisions?
 
If you have questions on this type of analysis or machine learning in general, please don’t hesitate to contact Gordon Summers of Cabri Group (Gordon.Summers@CabriGroup.com) or Nate Watson at CAN (nate@canworksmart.com).
 
Those interested in the detailed description of our analysis methodology can read the technical version of the article found here.
**Disclaimer: Any handicapping sports odds information contained herein is for entertainment purposes only. Neither CAN nor Cabri Group condone using this information to contravene any law or statute; it’s up to you to determine whether gambling is legal in your jurisdiction. This information is not associated with nor is it endorsed by any professional or collegiate league, association or team. Machine Learning can be done by anyone, but is done best with professional guidance.

Featured Posts – Click the Brain
Archives
CAN Jewels