How will the Post COVID-19 pandemic landscape in business be changed? Are we headed to a future like the Jetsons or one like Mad Max? Companies who once feared remote workers are waking up to the benefits of this work/life balance. Others are in panic mode because “we’ve always done it this way” no longer applies.
As a Data Science company, we are always looking ahead. One thing we get asked about is what should business be doing now to prepare for the world in the new normal. At our first in-person lunch meeting Post COVID-19 pandemic, we came to the conclusion the two book-ends are: Jetsons or Mad Max.”
We believe the major change is how customers now interact with companies. We have, because of the pandemic shown that companies can actually do just fine working from home, can deliver good like groceries, food, and even luxury items without the in-person experience, and that companies can do a better job using technology to deliver what the customer wants, when the customer wants it.
This is pandora’s box. We can’t go back. Because we had to do this to survive, now we have to continue to do it as part of our business model. However, what most companies built in haste, isn’t scalable. It is now time to rethink how we use the data we have (and the data we can get) to build a scalable solution that gives us insight into what customers want, and gives the customers what they desire–better access.
Interestingly enough, when going back through our past project history, we realize we have been building solutions for just this problem for years. Take for example the persona model we built for Omaha Public Power District (OPPD). It is a great example of how to use data for greater impact.
For OPPD, one of the few publically owned utilities in the entire country, our predictive model allowed them to understand which product or service each household had the highest chance to purchase, and then give that insight to their sales and marketing teams. This meant that:
Their customer service agents now had access to which products to recommend when they called in.
Their sales team knew which households were most likely to want each product, and
Their marketing team knew which product to market to each household.
Predictive modeling like this allows companies to “hit” more than “miss”. If your able to be more effective, even by a small margin, you may edge out your competitor. Tell that to Jacob Kiplimo who was on pace to set the world record for a 43:00 15km run. Kiplimo raised his arms to celebrate before crossing the finish line. It was then that Kibiwott Kandie passed him and finished in 42:59 and was the first to break the record instead.
Understanding how to start with data-driven decisions can be tough. Lucky for you, there is a company that can help you get this kind of insight, and teach you how to do it. Contact Us today and we’ll be happy to help ensure you hit the ground running post-COVID.
Machine Learning, Business Intelligence, and Artificial Intelligence are buzz words that are being thrown around at planning sessions a lot these last few years. They have real meanings that most people don’t understand. They are using them to mean “more sophisticated at using data to make decisions”. And while that is right, there is a right way and a very wrong way to lead your company down the path of using data to make data-driven decisions. After 10+ years of helping companies understand what that path is, we wanted to help you the reader understand the order and the real definitions of the buzz words. This way, you can not be educated, but you can give your company the direction it needs to go up the Data Hierarchy.
Data Science is in an integral part of everyday life at this point and you just don’t know it. As a society, we’re generating more data than ever before. Smart businesses are tapping into that data to do things that were previously unheard of.
Take Facebook for example. 20 years ago Facebook didn’t exist, now people are addicted to it and seemingly can’t live without it. But even then, people are still weary of the dreaded “Facebook algorithm” that cuts 50% of the posts you might want to see. That algorithm is data science at work
That’s right, you’ve generated enough data that Facebook wrote some code to cut 50% of your friends out of your life. You didn’t interact with them enough, they didn’t post enough, there are hundreds of reasons why that system feels like your college roommates buddy from down the hall with the cat doesn’t need to be at the top of your feed. It also looks at what you read on a regular basis and then tries to predict what you would want to read next.
So to help people truly understand what we do as a company, and to help you hire us. (let’s be honest) We put together a series on the sophistication of data usage as businesses mature that we call the Business Data Hierarchy. The goal of this series is to help people and companies understand where they are now, and where they could go with data driven decision making.
We’ve written the series to be informative and insightful, with a splash of humor mixed in to keep you awake through the whole process. If you like it or if you feel like someone needs to read this…we ask that you share the info or…better yet…get them in touch with us and we’ll bring the show to you! The pyrotechnic guys tell us we’ll need a 25’ ceiling for the fire and lasers…Hey, it’s a good show.
…this will also be the longest post of the entire series, don’t worry!
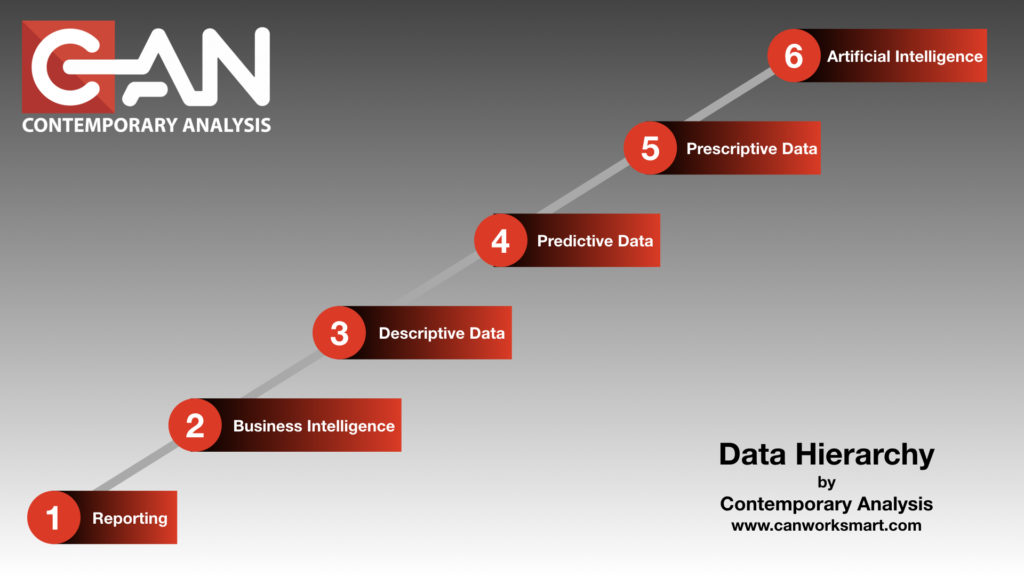
When you look at Data, and what it can do for you and your company, there are six different levels of Data Hierarchy. It’s a hierarchy because each level is codependent on another.
These levels are important to understand because jumping from one to another, without a long term goal, can be cost prohibitive. This is even more devastating when you finally get your executive level to believe in the power of data, and it breaks the bank in the execution.
“Skipping” leads to “Skippers”
There are consultants with lovely summer and winter homes who have paid for them “skipping” to the end and then back billing/building the solutions.
To insulate against catastrophic failure of a data-driven initiative we at Contemporary Analysis (CAN) have created a Data Hierarchy to help companies understand where they are and more importantly, where they are going. This understanding helps drive the strategy and vision needed to be successful. These levels are
Omnipotent AI (Skynet): “Automated Doing of its own recommendations” a.k.a. “Terminator Movies”
Every business is trying to move “forward”. If you work for a company whose response is anything but “forward” or “more” start polishing up your resume, you’ll need it sooner than later.
Most companies are so focused on today’s business they don’t know what the path to the future looks like.
Imagine you tell a CEO you’re going to walk a mile to get another 1 million in sales. Most CEO’s would look at the distance and agree that a short distance is worth the time and effort to get the additional revenue.
The sprint to 1 million
You and your team(s) work feverishly to get from point A to point B as quickly as possible. You cross the finish line and there’s your 1 million. The CEO checks the box and there it is, project complete.
Now imagine if you told a CEO you’re going to get 20 million in sales. After the confused look and possible laughing subsides you tell them how. Instead of a mile, you have to walk 15 miles. But you’re not going to do them all in 1 year. Instead you’re going to walk that distance over 5-6 years. You’ll measure success with each mile you pass and each mile will result in ROI for the company.
Mountain road in Norway.
You also let them know that you can cover the ground when and how you want to. If one mile is too tough to work in the time and effort this year, you postpone it to the next. If, as you’re walking, a business need changes and you need to walk a completely different direction you can. The steps remain the same but the road you use to get there is slightly different.
Understanding the long term goal allows you and your team(s) the ability to work smarter not harder. You’re building toward the vision at every turn so you have little to no wasted effort. And, because you’re building over time, you can staff accordingly for each mile and access the right talent at the right time
Part of CAN’s role is being that “Data Visionary” that helps you see over the horizon with possibilities. The hardest part of this whole process is getting the decision makers in an organization to embrace the culture of change.
“We’ve done it this way for __X__ years and it works just fine.” Is becoming the leading indicator of a dying business. If you’re 40 years old the technology available today wasn’t even conceptualized when you were in grade school. “We’ve done it this way for 50 years…” means you’re already behind the curve.
The posts that will follow will walk you through each level of the Business Data Hierarchy concept. We’ll be sure to include examples that are relatable. The subject matter can be a bit dry, so we’ll also make sure we include some humor along the way to keep things lively. We’re a Data Science Consulting firm..not monsters after all.
At any point, feel free to reach out and let us know how we can help you through these steps:
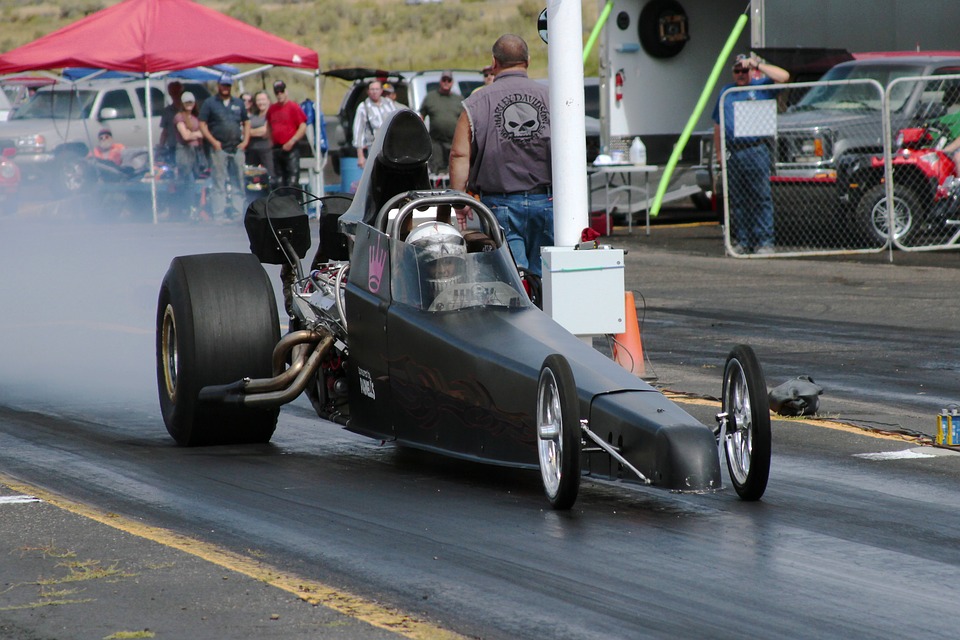
A couple weeks ago, I discussed the use of predictive analytics in the transportation industry, specifically the use of acoustic bearing monitors to predict bearing failures on Union Pacific freight trains. Today the conversation turns to predictive analytics in a very different type of transportation, Formula One (F1) racing. Download our Case Study on Mechanical Failure and Predictive Analytics.
F1 is to many the pinnacle of motor sports. F1 has the most technologically advanced cars, the most skilled drivers (some compensated $50+ million per year), the most exotic race locations, and yes, the most beautiful paddock girls. Formula One is a closely sanctioned “space race” creating and refining innovative and ground breaking technologies including traction control, anti-lock brakes, direct injection, synthetic oil, kinetic energy recovery systems (KERS), carbon fiber, and computational fluid dynamics (CFD). Many advancements made in technology by F1 teams have contributed to the efficiency and safety of everyday vehicles. (more…)