A Happy Halloween depends on knowing where to Trick-or-Treat
Once again it’s that time of the year when kids and parents prepare to hit the streets of Omaha in their ghoulish best looking for the most candy they can find.
For a kid, Halloween is one of the most (if not the most) exciting times of the year. They get to dress up, act like their favorite characters, and eat lots of candy. What could be better?
For a parent, Halloween can be a stressful event. Having to travel up and down several blocks to find enough candy while managing hyped up kids, and on top of that cold weather, can make for an awful mix on Halloween night. But what if you had a way to scout out the best neighborhoods around you to find candy before hand?
This year for Halloween, the data scientists at CAN took on this challenge to help parents and kids find neighborhoods with the most and best candy.
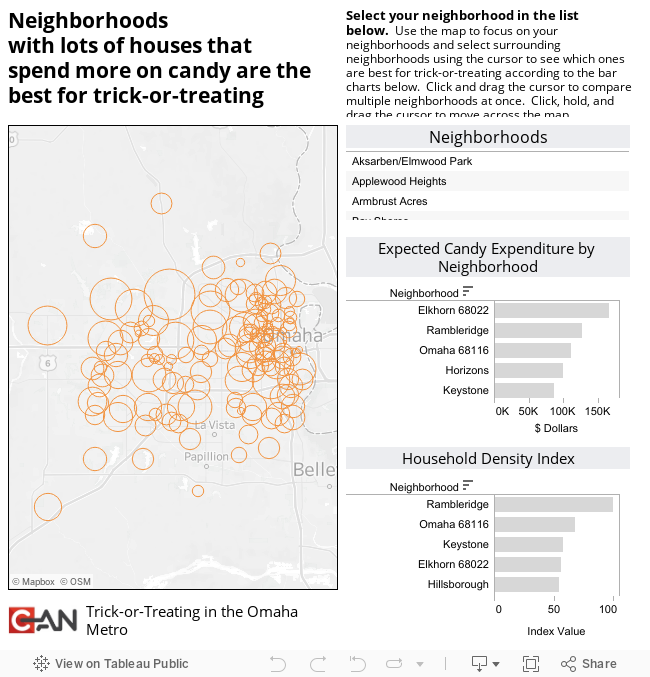
Using Block demographic and spatial data from the 2010 Census and Halloween spending data from the 2012 National Retail Federation, CAN’s data scientists developed a predictive analytics dashboard that allows parents to get a high level view of the expected spend on candy in their neighborhood as well as surrounding neighborhoods. Alongside spending, an index of household density is also included to show which neighborhoods may hand out the most candy on Halloween night.
“Last year we realized we could use the data we were gathering on household demographics and combine it with estimated spending data on Halloween candy for each neighborhood,” Tadd, COO and head of data scientist says. “I worked with another data scientist, Matt Dickinson, who built the concept of the dashboard last year for the Greater Omaha Tableau Users Group, to publish this fun dashboard and give parents the upper hand when planning their Halloween night.”
The tool is interactive and lets the user choose which part of town they are in or which neighborhoods they want to compare. “This is very similar to some of the visualizations we develop for companies to understand their customers and help guide strategies for developing better marketing campaigns,” continues Tadd. “I am happy we get to use our expertise to showcase some fun analytics as well.”
So if you want to take a proactive approach to getting your little ghouls’ bags filled with candy, use this predictive analytics dashboard to make your Halloween night boo-untiful!


I hope everyone gives Tadd Wood and Matt Dickinson the love they deserve for building the CAN Trick-or-Treat Dashboard. I think we will continue to build fun dashboards.