Where in the world CAN you find us?

In the next few years, CAN is predicted to be among the nation’s leaders in data science. We have an impressive resume to back this up. We’ve worked with multiple Fortune 500 hundred companies, and many more Fortune 1000 companies all over the globe and have built a solid reputation among local Omahans for producing experts in data science and IT.
A year ago we joined up with Interface Web School and created the Omaha Data Science Academy (Oma-DSA). Our dedication to educating our community — from recent college graduates to single moms looking for a new career — has bolstered our reputation as not only an upstanding professional service but also a down-to-earth, human-to-human, educational source.
We also have an impressive network of CAN alums (Oma-DSA grads and former CAN employees) to prove this educational dedication. When you work for CAN, we don’t just want you to improve our company. We want you to improve yourself. That’s why so many of our graduates and employees have moved on to work for businesses all over the country, and to start their own businesses.
We have AIM and The Startup Collaborative to thank for our continued success. As CAN turns a year older, a lot of people are stopping us to ask this question:
 

Will CAN stay in Omaha?

Of course we will.
Does that shock you? To some it might seem like the next logical step for CAN is to move to a bigger city where there are more businesses, take on investment, and find more talent. But’s that not how we see it. We think Omaha is perfect.
Let’s examine the two mottos of the area: Omaha and Council Bluffs (Omaha’s sister city across the river from Omaha).
Omaha’s motto is “We Don’t Coast”. This has two meanings. This first is literal. Obviously, we don’t have coasts. And to add to that, we don’t mountain either. But the metaphorical meaning is even more true: we’re a city of do-ers. We don’t slack. We don’t waste time. We act on our ideas. We collaborate. We make waves.
Council Bluff’s motto is “Unlike Anywhere Else. On Purpose.”. Our friendly, work-hard, be-nice attitude, does not come naturally; rather, it’s something we strive to be. We know it puts us ahead. We don’t have to try to be hip and trendy, our values are more genuine. We’re happy with our identity.
What is Omaha’s identity? Let’s dive a little deeper.
 

Omaha’s bragging rights

Every town in the country has that one special thing that draws tourists, like a giant ball of yarn or a natural history museum. Omaha has more than gimmicks, however. We have the whole package.

We have the people.

We spoke a little about our personality in reference to our mottos. One phrase that CAN likes to use to describe the good people Omaha is “homesteader mentality.” We’re not afraid to put in hours and work. The 9-5 workday is not always our mode of operation when a job needs to be done. We work overtime to accomplish goals, and we approach problems with the end goal of figuring out a solution, not just putting in hours. 
Anecdote: Our original Founder used to tell people we only worked half days…7am to 7pm…
We also have a different kind of people. Because Omaha doesn’t have the density of other big cities, we have had to make our actions “on purpose”. In Omaha, people are willing to give advice and collaborate. Since everyone is connected in someway, with the right idea anyone could have lunch with 1 of the 5 billionaires that live in Nebraska. On the coasts, these people would be way to pre-occupied to give just any idea the time of day.
Most importantly, the people of Omaha understand good enough. We’re not caught up in the fame game. You could say we’re slow and steady, because we strive for improvement, not perfection. We don’t cut corners, we work hard to build ourselves up. Just like CAN has done in the past 9 years.

We are the place.

We’re not just small town in the middle of the country. Omaha has a global reach that surpasses many of the other bigger cities in the MidWest. Omaha is a business community. 
For instance, not so long ago Omaha was the equivalent of Silicon Valley for telecommunication. A lot of these big corporations are still headquartered in Omaha. Omaha currently has 4 Fortune 500 company headquarters.
Our agricultural companies ship grain all over the world, and we manage money for people across all six inhabited continents.
This spirit of success continues at every level. You can see it in the halls of the start-up collaborative. People young and old come to work on tech-related ideas and products that they believe will boost up Omaha’s name even more. 
Omaha is also a major transportation hub, with the largest N/S and E/W interstates running through the city and the nation’s largest railroad located downtown. In four hours you can go just about anywhere in the country from our airport, making Omaha a major crossroads of tech and transport.
Not to mention our cost of living is among the lowest in the country. Less personal expenses mean you can invest more in your business. More investments equals more momentum for success.
Still, starting a business in Nebraska has its challenges. Constraints, however, often produce creative solutions. With a state population of 1.8 million, isolation has been CAN’s biggest constraint. Isolation has forced CAN to learn to build a national client base using blogging, social networks, and virtual meetings.
We knew that this results-oriented culture of Omaha would help us create a business that provides real value for our customers and help to keep our business focused on the long-term instead of quick wins.

We have some cool things.

You probably don’t need a whole lot more convincing, but here’s a few websites that list awesome social and cultural aspects of Omaha:

  1. “8 Reasons to Move to Omaha, NE”
  2. “7 Reason why Omaha is the Best City in the US to Live In”
  3. “30 Things You Need to Know About Omaha Before You Move There”

Food, fashion, furry things. When we at CAN aren’t busy working on projects, we have unique opportunities to explore the MidWest culture.  
 

CAN Loves Omaha

Between the travel opportunities, the global reach, the hard-working mentality, and the room for growth, CAN couldn’t choose a better city for their headquarters. Omaha is producing more tech talent every year at half the price of those on the coast. CAN wants to hire this talent, give them real data analytics experience, and send them wherever they need to go. Without the resources and mentality of Omaha, this would not be possible.
In the end, CAN is going anywhere. We believe in our community, we believe in improvement, and we believe in sticking with our roots. 
Analyzing Omaha Mayoral Election Data Uncovers Voting Patterns

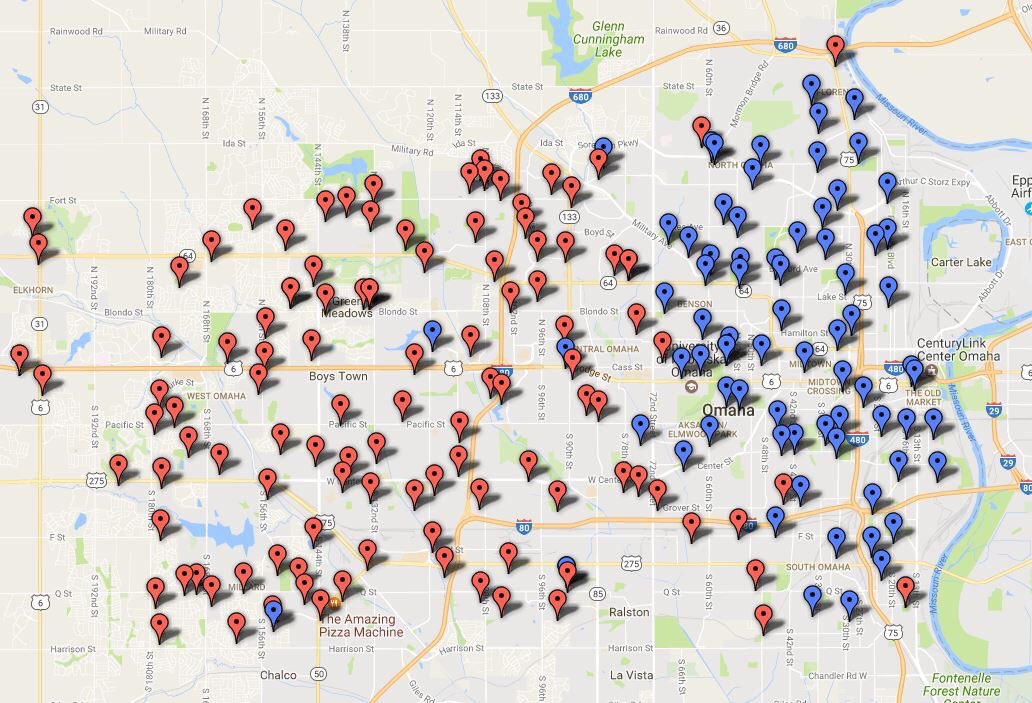
Last week, incumbent Jean Stothert won re-election in the 2017 Omaha Mayoral Election, defeating challenger Health Mello by a 53-to-47 percent margin. Let’s take a closer look at how the Republican fared in the polls over her Democratic challenger.

This map was created by the Omaha World-Herald staff shortly after election results were announced on May 9th. It was widely shared on social media in the days following the election and simply represents the results from each precinct — red for Stothert, blue for Mello. It shows a striking political contrast between East and West Omaha. Using this visualization, it appears the city can be divided into two halves, with Republicans on one side and Democrats mostly on the other.
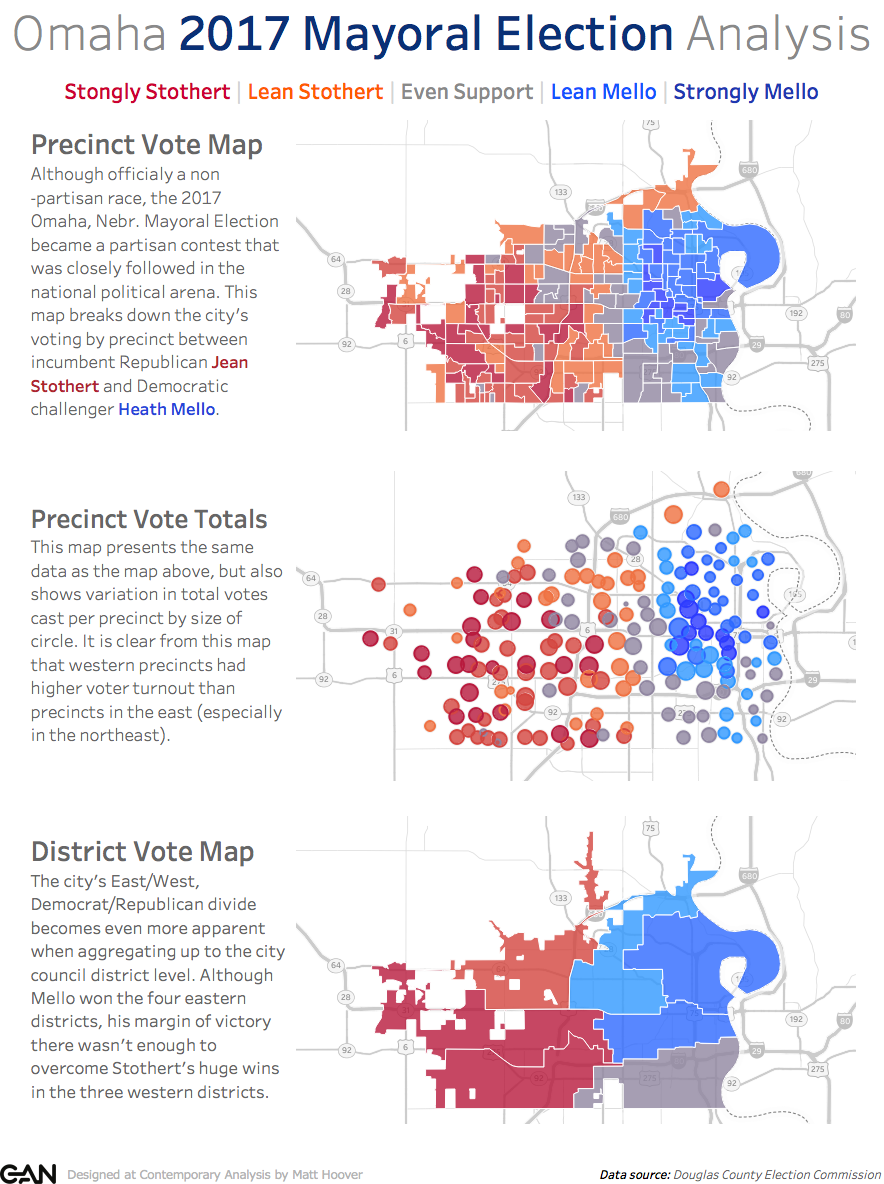
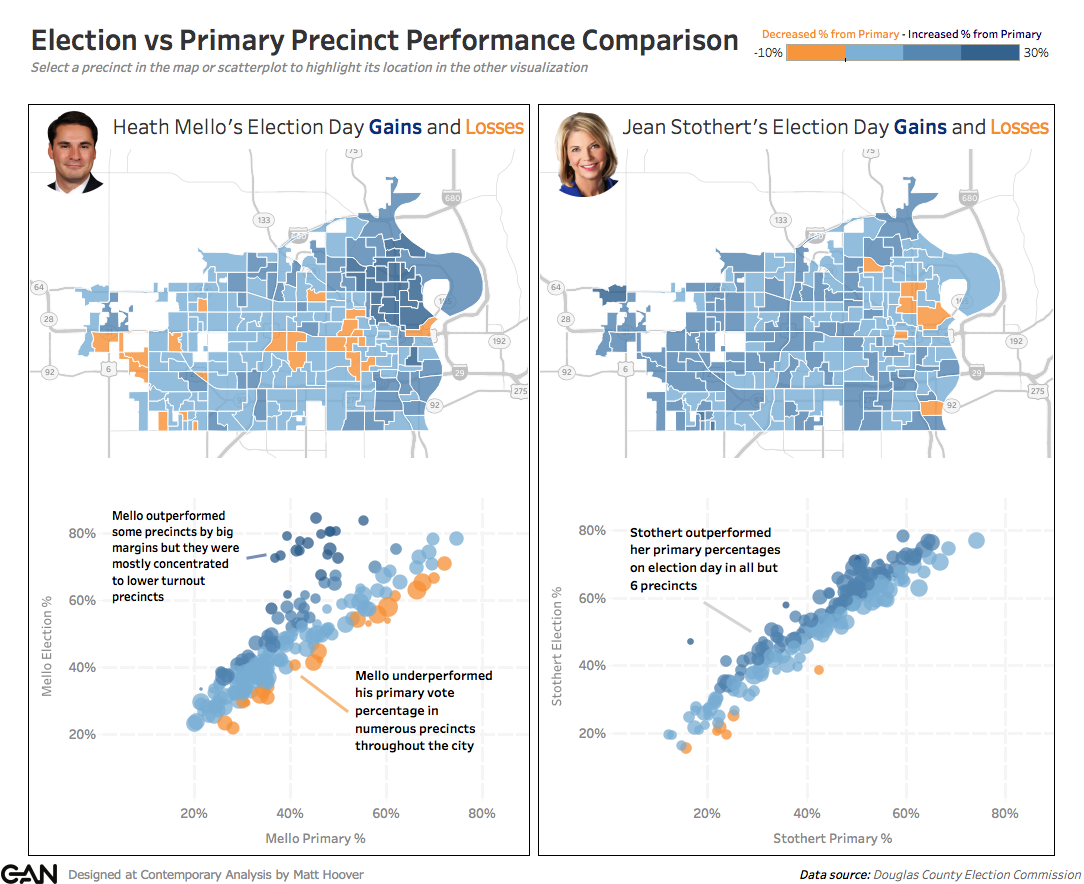
Although the map is technically accurate, it is somewhat misleading because it only shows the data in one dimension. This is not meant to discredit the creator of the map – this is an effective visualization that succinctly tells one story. It is also impressive how fast the map was put together after the election results were announced. With that said, the map doesn’t account for important metrics such as number of voters per precinct or margin of victory. To provide this context and better understand voter behavior throughout the city, I used election data from the Douglas County Election Commission’s website and created some improved, in-depth Omaha Mayoral Election visualizations. Make sure to click on the images if you would like to go to the interactive version of these visualizations.
 

Red City | Blue City – Omaha Divided


Election vs Primary Performance by Precinct


Were you surprised by the results of the election? What other metrics would you like to see in these data visualizations?

Check out Data Science Central

Open up any computer at the CAN headquarters and you’ll see our favorite data science website as our homepage: datasciencecentral.com. Articles, webinars, resources, ideas, tools, you name it. If it’s related to data science, it’s there.
Today, we’d like to share some knowledge from Rick Riddle. Check out his article “How can organizations successfully convert big data into real-world decisions?” by clicking on the link.
It’s all about how to apply the stacks and stacks of data your business has on file to real-life decisions. Which is what CAN is all about: using your data to help you. It may seem an overwhelming task, but CAN’s data scientists love challenges. Read over this article and let us know if you think we can help you with your data needs.
Contact Nate Watson at support@canworksmart.com.

The Man Behind the Scenes: An Interview with Nate Watson

Last month, TechBus interviewed our very own President, Nate Watson. TechBus is an Omaha-based group that posts bi-weekly interviews about local businesses and new technology.
This video is everything you’ve ever wanted to know about CAN: who we are, what we do, how we’re related to the Data Science Academy, and how our staff augmentation model works. It’s a great way to get a glimpse into CAN for those who may be interested in contracting us, being employed by us, or being taught by us at the Oma-DSA.

To schedule a phone call with our very own Nate Watson, send us an e-mail at nate@canworksmart.com.

Women in Tech: A Visualization from Tableau Public

Here at CAN our free-time is spent researching the latest trends in and facts about data science. In a skim of Tableau Public, we found this fascinating visualization about women in tech. Tableau Public is a platform to post data visualizations made with Tableau. You don’t have to be a data expert to share a visualization, you just have to be excited about data.
With this particular visualization, you can see how many fewer women receive tech-related degrees than men. As women are quickly overtaking men in educational status, it’s more important than ever to attract their attention to the opportunities of the tech world. We at CAN believe in giving a real-life data science education to all who want to pursue it. That’s why we created the Omaha Data Science Academy with Interface Web School. Sound like something you’d like to know more about? Check out more information here.

Matt Hoover Reps the Startup Collaborative

Check out the video below of one of our data scientists and Director of Data Visualization Matt Hoover giving a tour of the The Startup Collaborative. Matt was interviewed by Omaha tech company Dynamo. Dynamo is a new kind of IT consulting and recruiting agency that is based on an understanding of who companies actually need — valuing people and culture fit over transactions and placement fees.

Dynamo + Matt Hoover from Brody Deren on Vimeo.

CAN HQ @ The Exchange Building

In the video you’ll watch Matt as he shows off the Omaha Startup Collaborative’s coworking space at the Exchange Building, learn a little about the Omaha Data Science Academy, and see up close footage of CAN’s headquarters. Matt also mentions his newest project involving March Madness, Creighton basketball, Tableau, and statistics. Sound intriguing? Find out more here.

Single Mom of Three Rocks Web Development World

We found this article on Interface’s blog. We thought it was an awesome story about how Interface’s web school turned a busy woman’s career around. Despite obstacles of daily life, Miranda Tharp jump-started a web development career.
DSC_4754-300x300
To read the full article about, click here.
Interface partnered with CAN at the end of last year to create The Omaha Data Science Academy. With a certificate from the Data Science Academy, skilled professionals can boost their resumes with additional real life experience.

Machine Learning Upset Prediction Project Proves its Value

At the beginning of the project, we set out to show how the 2017 NCAA College Basketball Tournament could be a proving ground for Machine Learning analysis. There are very few places in the world where we can use the same model to predict multiple outcomes in a short period of time, have a ready-made scorecard (Vegas), have the general public understand what we are trying to do, and have a chance to “beat” the algorithm with their own knowledge.
You could say our findings have been a “Slam Dunk” (I couldn’t help myself).
Before diving into the results, I wanted the reader to understand what we were up against. It’s easy to pick chalk (always picking the better seed). In fact, that is how the games are supposed to work. The 8 seed is supposed to beat the 9. And for the most part, the NCAA does a decent job. Historically, only 26% of tournament’s games end in an upset (this includes games from all rounds). That’s 17 out of 64 games. This was never going to be easy.
 

Project Recap

We predicted 20 upsets and got 10 right (50%). We only missed predicting 3 upsets.
Using Vegas as a scorecard and having bet $100 “dollars” on each predicted upset, we would have ended up +$2,605 off our simulated bets (a 30% ROI)–the majority of this coming from long shot underdogs.
Think about this. If we would have bet all chalk on games except the ones the algorithm predicted as upsets, then out of 61 games we would have only missed 13. That’s 79% accurate!
Let’s look at this another way. Our algorithm predicted 77% (10/13) of something that is only 26% likely to happen in the first place. Now think about what you would do if you could identify an unlikely event in your business with 77% accuracy.

  • What would you do if you knew 77% of the customers who were going to leave before they left?
  • What would you do if you knew 77% of failed batches before they happened?
  • What would you do if you knew 77% of your plant’s machine failures before they happened?

Business Scenario

You have a theory that some of your clients would buy more “product” if they were called and offered an upgraded deal. However you don’t want to call all of your clients because you have so many. What you do have is a dataset of past customers that successfully responded to this type of nudge. Using your data, our machine learning algorithm could predict a set of your clients that would be 77% likely to purchase more product if called.
 
Game changer right?
 

Why this is huge

Our Machine Learning lower seed winning project was looking to predict as accurately as we could a lower seeded team winning in the NCAA tournament. Our stated goal from the beginning was to get 47% of our picks correct and a mere 10% ROI. We beat both of those goals. Our Machine Learning algorithm, which uses a custom optimization engine called Evolutionary Analysis, looked at a comparison of 207 different metrics of college basketball teams and their results in prior tournaments. It selected ranges of those 207 measures that best matched up with historic wins by lower seeded teams. We then confirmed that the range was predictive by testing the selected ranges against a “clean” historic data set. This comparison is how we got our goal percent and ROI. We then published our forecasts before each round was played – the results speak for themselves.
While we still have 3 games to go, our initial point that Machine Learning can help you be better at making decisions from your data has been proven. Implementing Machine Learning isn’t hard so long as your business has these three characteristics:

  • A data set with a large number of characteristics
  • A measure of success to optimize upon
  • A desire to learn from data to make changes in your organization

 
If this sounds like something that your business could use, please contact Nate Watson of CAN (Nate@CanWorkSmart.com) or Gordon Summers of Cabri Group (Gordon.Summers@CabriGroup.com) today.


Prediction Results

Here is a summary of our picks from the beginning of the project ($ indicates our successful pick where “money” was made):

East Tennessee St. over Florida
$ Xavier over Maryland
Vermont over Purdue
Florida Gulf Coast over Florida St.
Nevada over Iowa St.
$ Rhode Island over Creighton
$ Wichita St. over Dayton
$ USC over SMU
$ Wisconsin over Villanova
$ Xavier over Florida St.
Rhode Island over Oregon (tied with a minute to go)
Middle Tennessee over Butler
Wichita St. over Kentucky (tied with a minute to go)
Wisconsin over Florida (OT last second shot)
$ South Carolina over Baylor
$ Xavier over Arizona
Purdue over Kansas
Butler over North Carolina
$ South Carolina over Florida
$ Oregon over Kansas

And for those who are curious, our algorithm has detected one Final Four upset for this weekend:

Oregon over North Carolina

For more information about how we created the Machine Learning algorithm and how we kept score, please read our Machine Learning technical document. Additionally you can find results for the whole tournament here.

2017 NCAA Tournament Elite Eight Upset Picks

We are doing better than anticipated even after the heartbreaker of a game last night between Wisconsin and Florida and are still ahead $165.
 
Here are our Round 4 Potential Upsets:
 

South Carolina over Florida

Oregon over Kansas

 
We will have a weekend breakdown of all of our picks on Monday.
 
For more information about how we created the Machine Learning algorithm and how we are keeping score, you may read the Machine Learning article here:
 
http://can2013.wpengine.com/machine-learning-basketball-methodology
 

2017 NCAA Tournament Machine Learning Prediction Results

After the first weekend of basketball, our Machine Learning Prediction tool has good results.
We had two measures of success: We wanted to win at least 46% of our picks and we wanted to “win” using virtual money bet on the money lines. By both measures, we had success: We correctly picked 6 upsets out of the 13 games we chose (46%) and we won $1,359 off the 6 correctly picked upsets (profit of $59 on $1300 laid ($100 per game) or 5% ROI).
The details:
Overall there were 10 instances where the lower seed won in the first two rounds. This year is on track for fewer lower seeds winning (22%) than the historic rate (26%). So even with “tough headwinds” we still came close to our expectations.
“But CAN, there were multiple lower seed winning that you didn’t pick. Why didn’t the model see Middle Tennessee upsetting Minnesota?” The answer is simple, MT winning was a result of variables that we weren’t measuring. Our picks were based on games that matched our criteria were based on variables found in most (not all) of the games in which the lower seed won in past years. Lower seeds can and will still win, our model was built to predict the highest number of upsets without over picking. This is actually the perfect example of a model, even great ones, will not predict all. However, most, even some, in business, can mean huge revenue increases or monies saved.
Besides we had some really, really close calls that would have put us way, way ahead. There were several games where we had that the lower seed having a good chance of winning and they simply lost (Both Wichita State and Rhode Island had the games tied with under a minute to go). We picked multiple games where the money lines showed Vegas gave no chance of the upset, yet the teams came very close. Our play was to choose games that match the criteria and spread the risk over several probable winners. This wasn’t about picking the only upsets or all of the upsets, this was about picking a set of games that had
Our goal was to not choose games in a vacuum (which is how you bet), but instead to choose games that match the criteria and spread the risk over several probable winners. This wasn’t about picking the only upsets or all of the upsets, this was about picking a set of games that had the highest probability of the lower seed winning. And by our measures of success, we achieved our goal.
We aren’t done quite yet either.
For the next round, we have 5 games that match our criteria:

Wisconsin over Florida
South Carolina over Baylor
Xavier over Arizona
Purdue over Kansas
Butler over North Carolina

**If any games match our predictive criteria in the next round, we’ll post them Saturday before tip-off.
The results of the first rounds:
The Machine Learning algorithm performed as advertised: It identified a set of characteristics from historic data that was predictive of future results. The implications for any business is clear: if you have historic data and you leverage this type of expertise, you can predict the future.
For more information about how we created the Machine Learning algorithm and how we are keeping score, you may read the Machine Learning article here:
http://can2013.wpengine.com/machine-learning-basketball-methodology
If you would like to see how Machine Learning could improve your business, please feel free to reach out to either of us: this can relate to your business contact Gordon Summers of Cabri Group (Gordon.Summers@CabriGroup.com) or Nate Watson of CAN (nate@canworksmart.com).
 

Featured Posts – Click the Brain
Archives
CAN Jewels