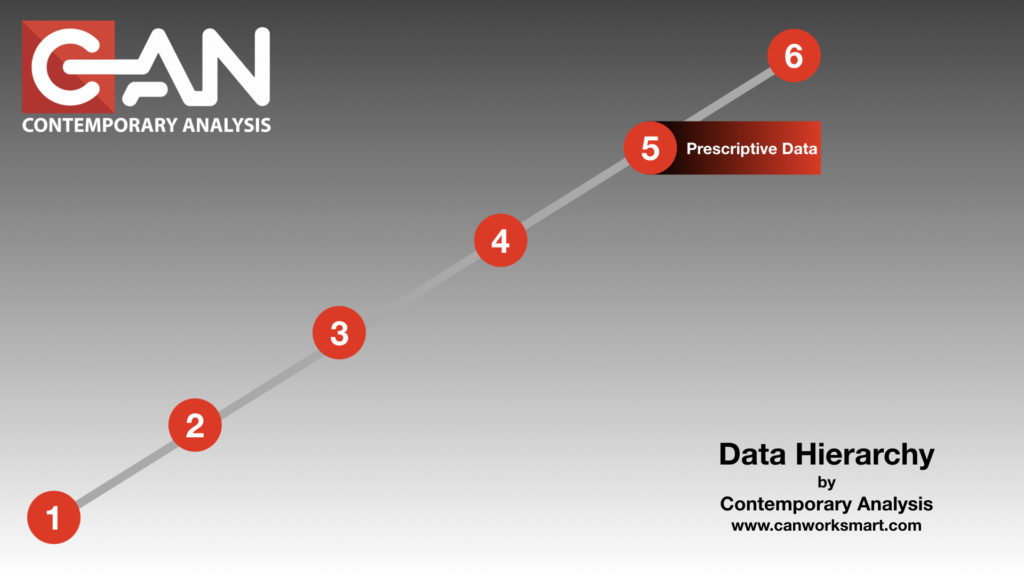
Level 5 – Prescriptive Data
I didn’t want to say it…but using the last levels Predictive Data analysis, we were able to predict you’d want to read this one too. Obviously that’s a joke, but prediction is pretty powerful when its correct.
So you can now predict the future with your data because you’ve followed the Data Hierarchy steps. Congratulations, you’re still not the coolest kid on the block.
Predictions are more accurate “what if” type of scenarios. You as a person have to make the decision on how to get there. This is actually the difference between levels 6 and 7 which we will get to in a second.
Prescriptive Data is the “what should we do about it” phase. (for example) Your Predictive model spit out 5 highly likely outcomes. Your team all agree they would be great if you could make them a reality. Prescriptive Data takes the same data set and looks for adjustments and/or variables to help achieve those outcomes. Prescriptive Data gives you the actionable items that increase the likelihood of your predictions even more.

Anybody who’s ever hit a golf ball knows there are dozens of split seconds in a golf swing that equate to hitting the ball correctly. Get them all right, and you’ll beat Tiger Woods. He’s good, but he’s not perfect. Get 2 or 3 of those moments wrong, and you’ll probably end up in the woods at the worst possible time.
In business your “golf swing” is how you execute decisions. Lets say your biggest competitor is the Tiger Woods of your industry. They get 15 out of 20 of the little things right almost all the time. Pretty good, can’t compete with them right? Wrong! They’re still missing 20% of the things that make them good.
Prescriptive Data looks at your swing. Because you’ve used the previous steps you know you are doing 13 out of the 20 things right. Prescriptive Data runs hypothetical “tweaks” to your swing at every point with every variable until it can get 17 out of 20. (for example)

Your data will tell you at any given point in your “swing” if you do X then Y will happen more often. And its proven by the historic data you have on 1000’s of swings before. Tiger Woods won the 2019 Masters by 1 stroke…1 stroke. Xander Schauffele, the guy who LOST by 1 stroke, wasn’t beaten by a vastly superior golfer…he was beaten by a detail (or more) being wrong in 2 swings. A foot that was ¼ inch out of place, a shoulder that dipped ⅛ of an inch too low, and worst of all…he probably hit those shots and could feel it wasn’t perfect.
Hundreds of people leave cable companies every year. For what? A myriad of reasons. Better price, free HBO, wireless boxes, faster internet, Game of Thrones is finally over, and more. The ironic thing is that most people leave a cable company to get a feature the current company could have sold them if they
(1) Knew they were going to leave (predictive analytics)
(2) knew what they were leaving for most likely (descriptive analytics)
(3) knew what to sell them to keep them–free HBO on a phone call to see how they liked their cable (prescriptive data).
It’s only with Prescriptive Analytics that the whole hierarchy starts to make sense (and pay off).
**Next weeks post will be on July 3rd to accommodate the holiday**
Quickly jump back to the previous segments using the buttons below.

