Tableau is a data visualization software that CAN uses daily with our customers. We even...

Bloggers Writing About Tableau
read more
Tableau is a data visualization software that CAN uses daily with our customers. We even...
History is a fascination for us at CAN for two reasons. The first is that we find our...
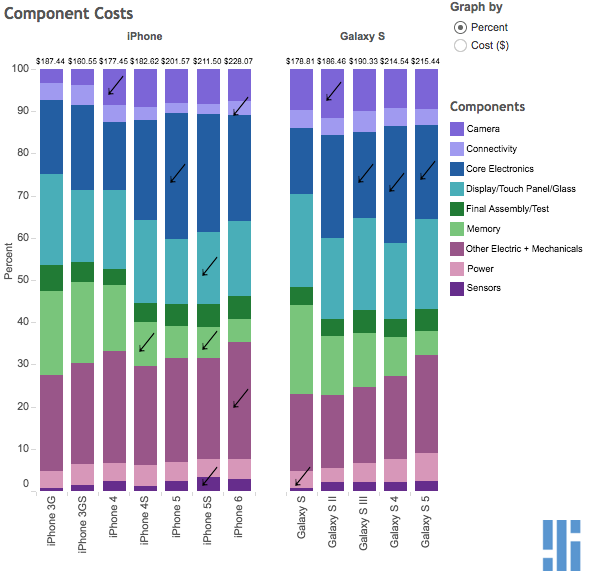
The iPhone versus Galaxy debate. There just doesn't seem to be a clear way to compare...
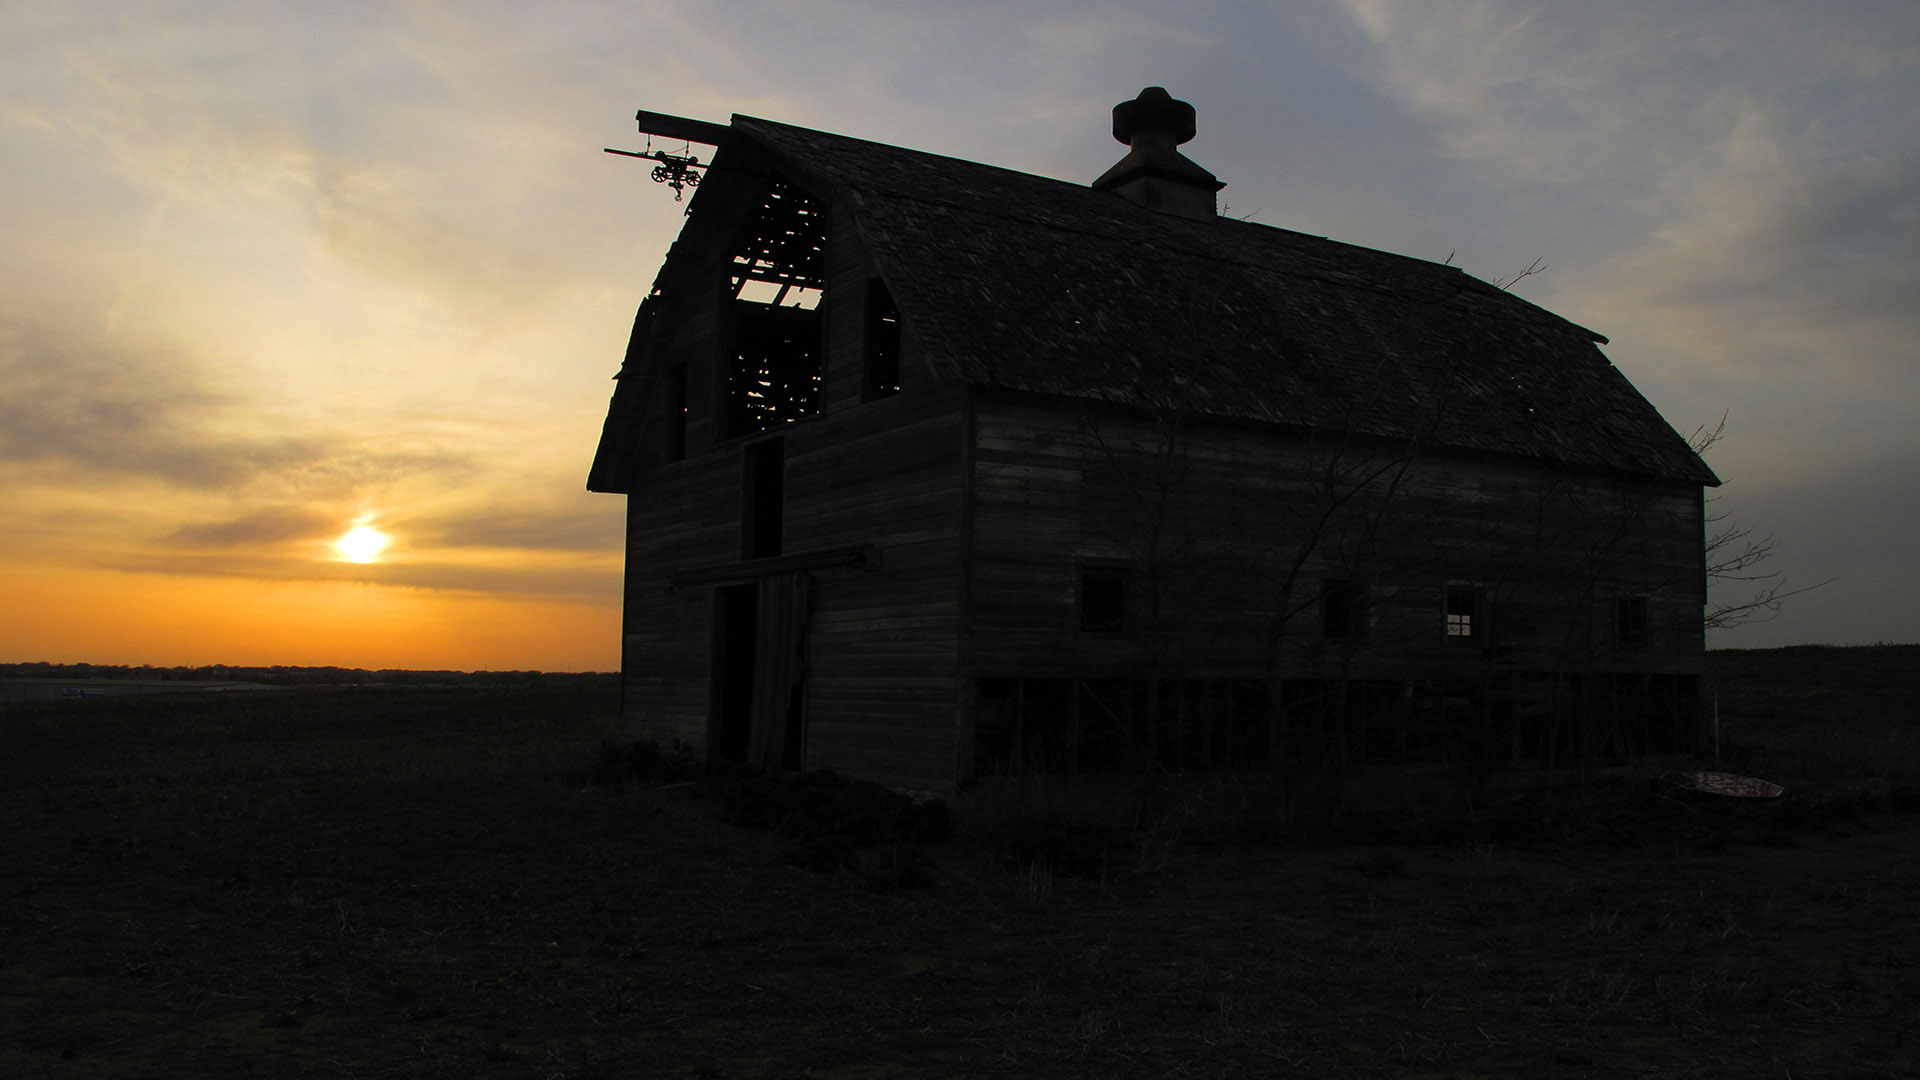
Do you think the Midwest is just a bunch of old barns and prairie grass? Think again....
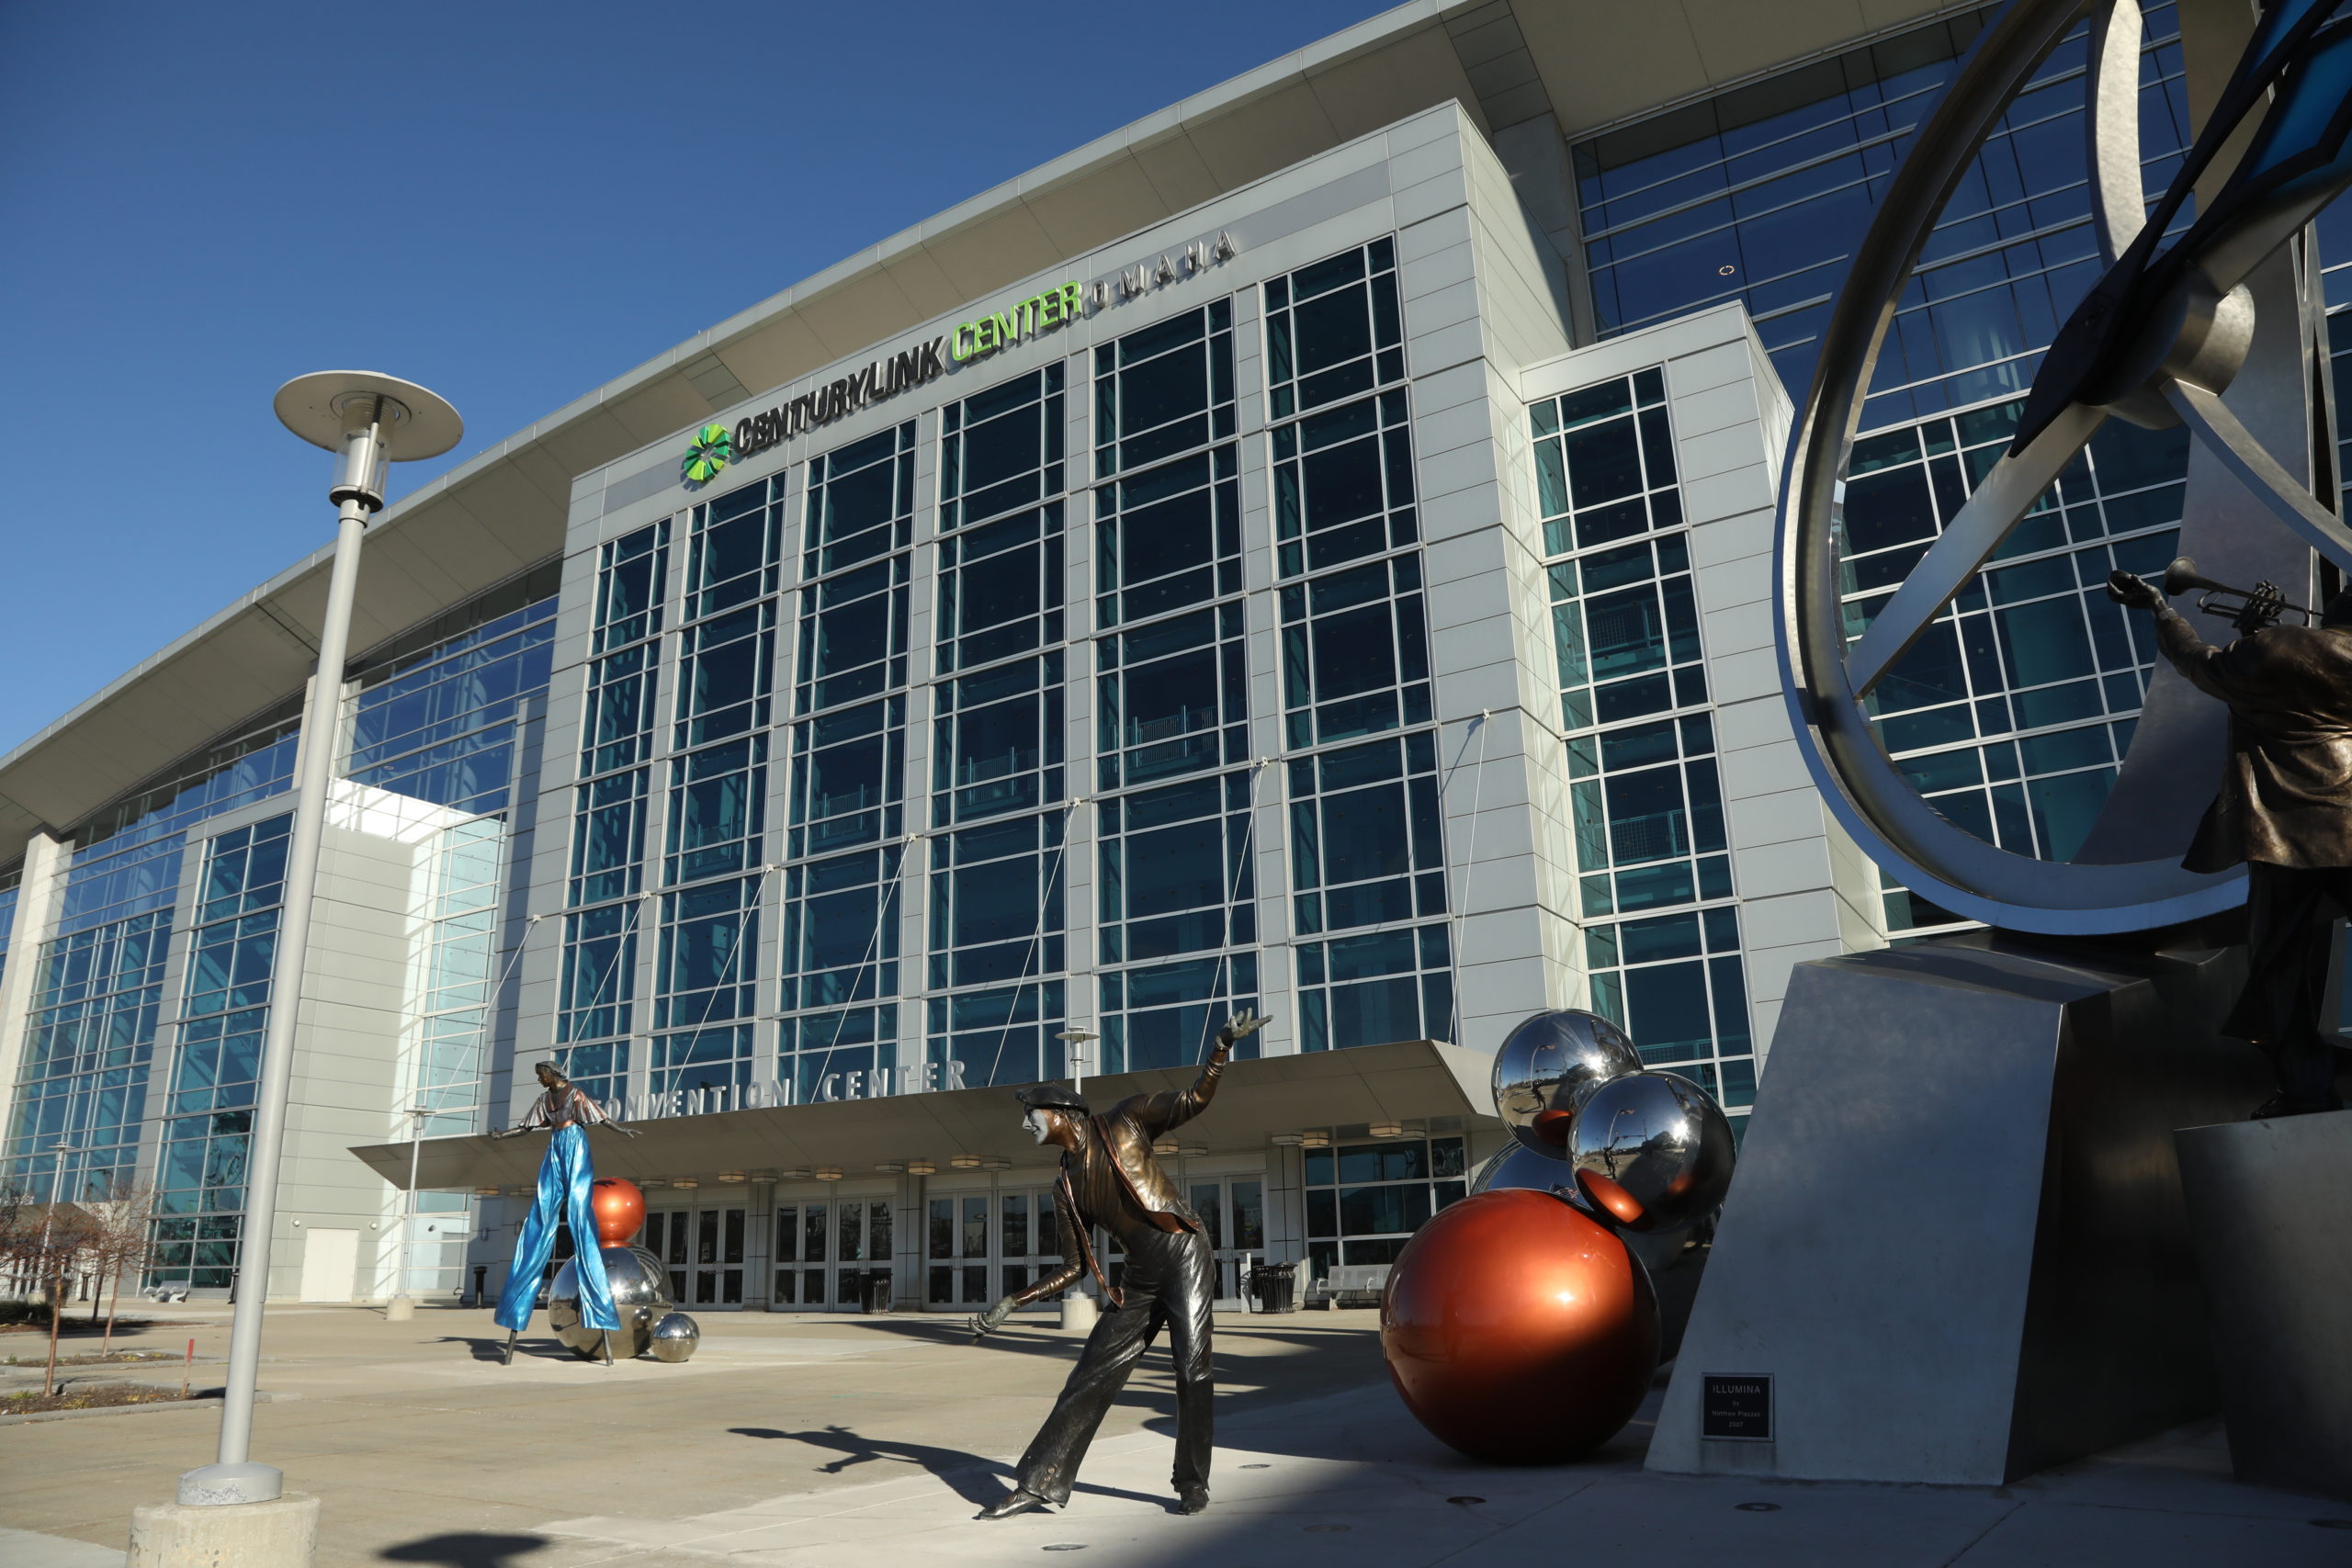
In the next few years, CAN is predicted to be among the nation’s leaders in data...
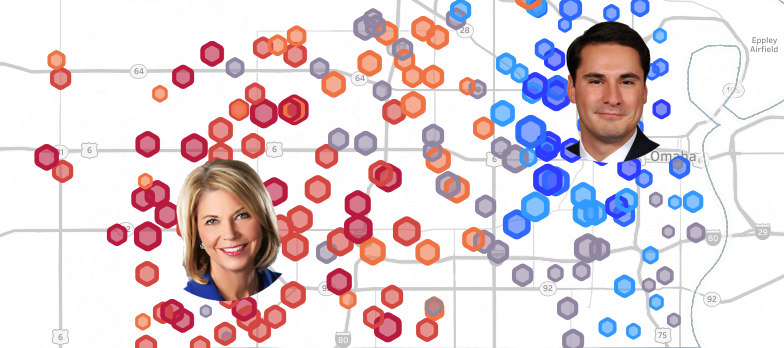
Last week, incumbent Jean Stothert won re-election in the 2017 Omaha Mayoral Election,...
Open up any computer at the CAN headquarters and you'll see our favorite data science...
Last month, TechBus interviewed our very own President, Nate Watson. TechBus is an...

Here at CAN our free-time is spent researching the latest trends in and facts about data...