Today is Contemporary Analysis (CAN)’s 10th birthday!!! Although we are not the company...
CAN turns 10!
read more
Today is Contemporary Analysis (CAN)’s 10th birthday!!! Although we are not the company...
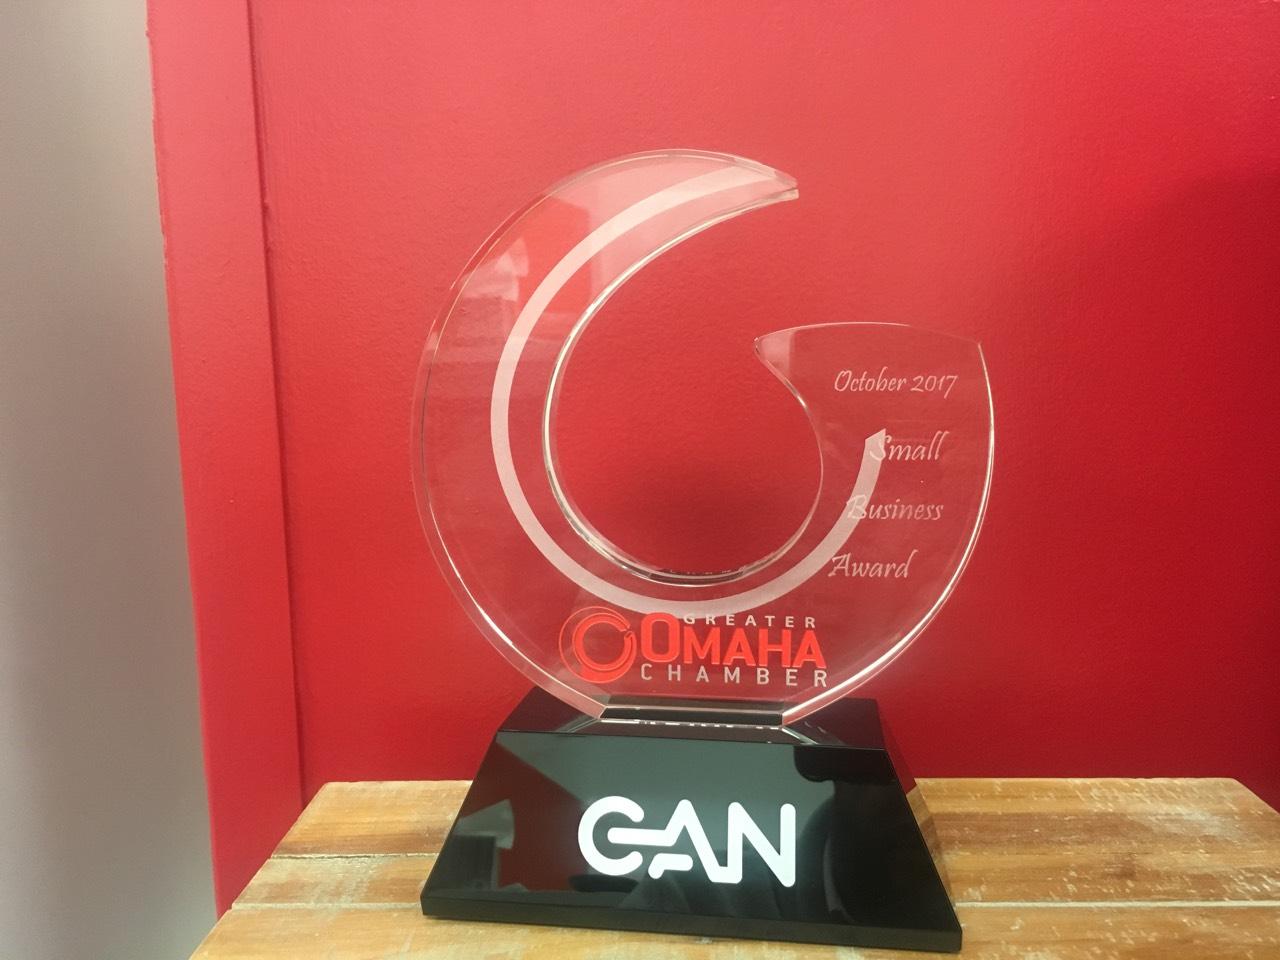
Recently, Contemporary Analysis (CAN) was presented with the Greater Omaha Chamber’s...
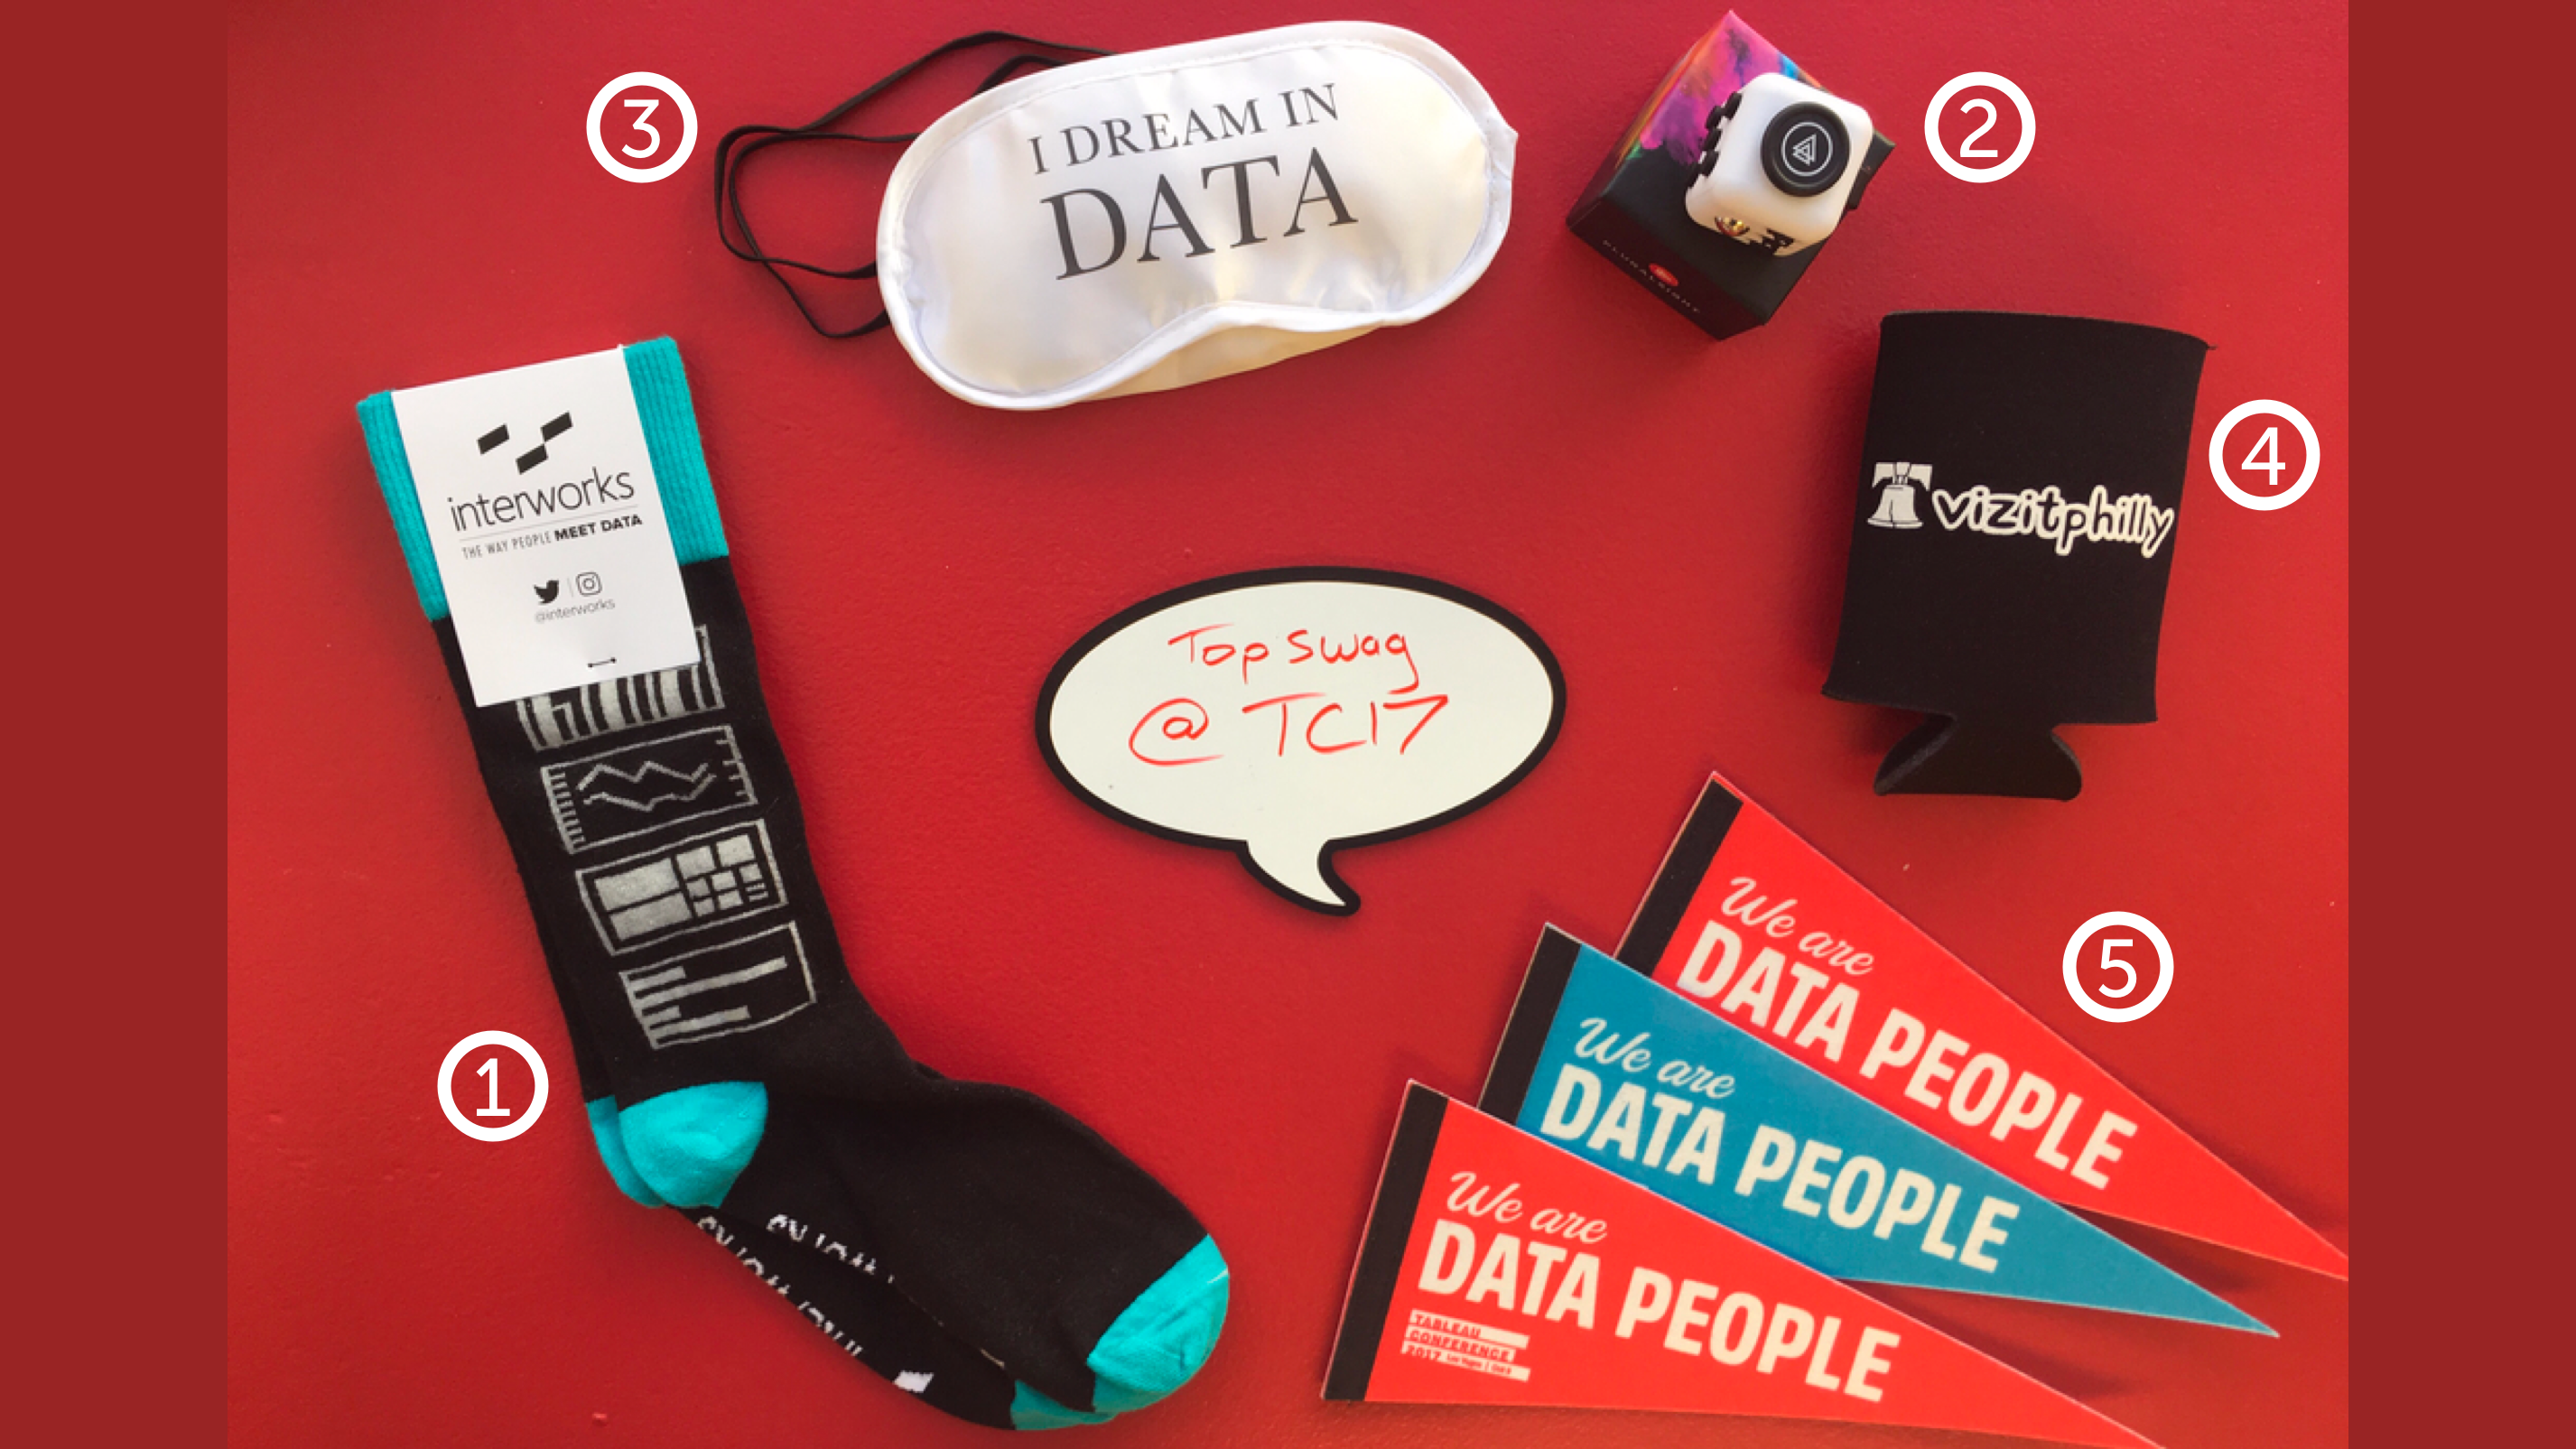
CAN recently got back from Tableau's 2017 customer conference, affectionally shortened...
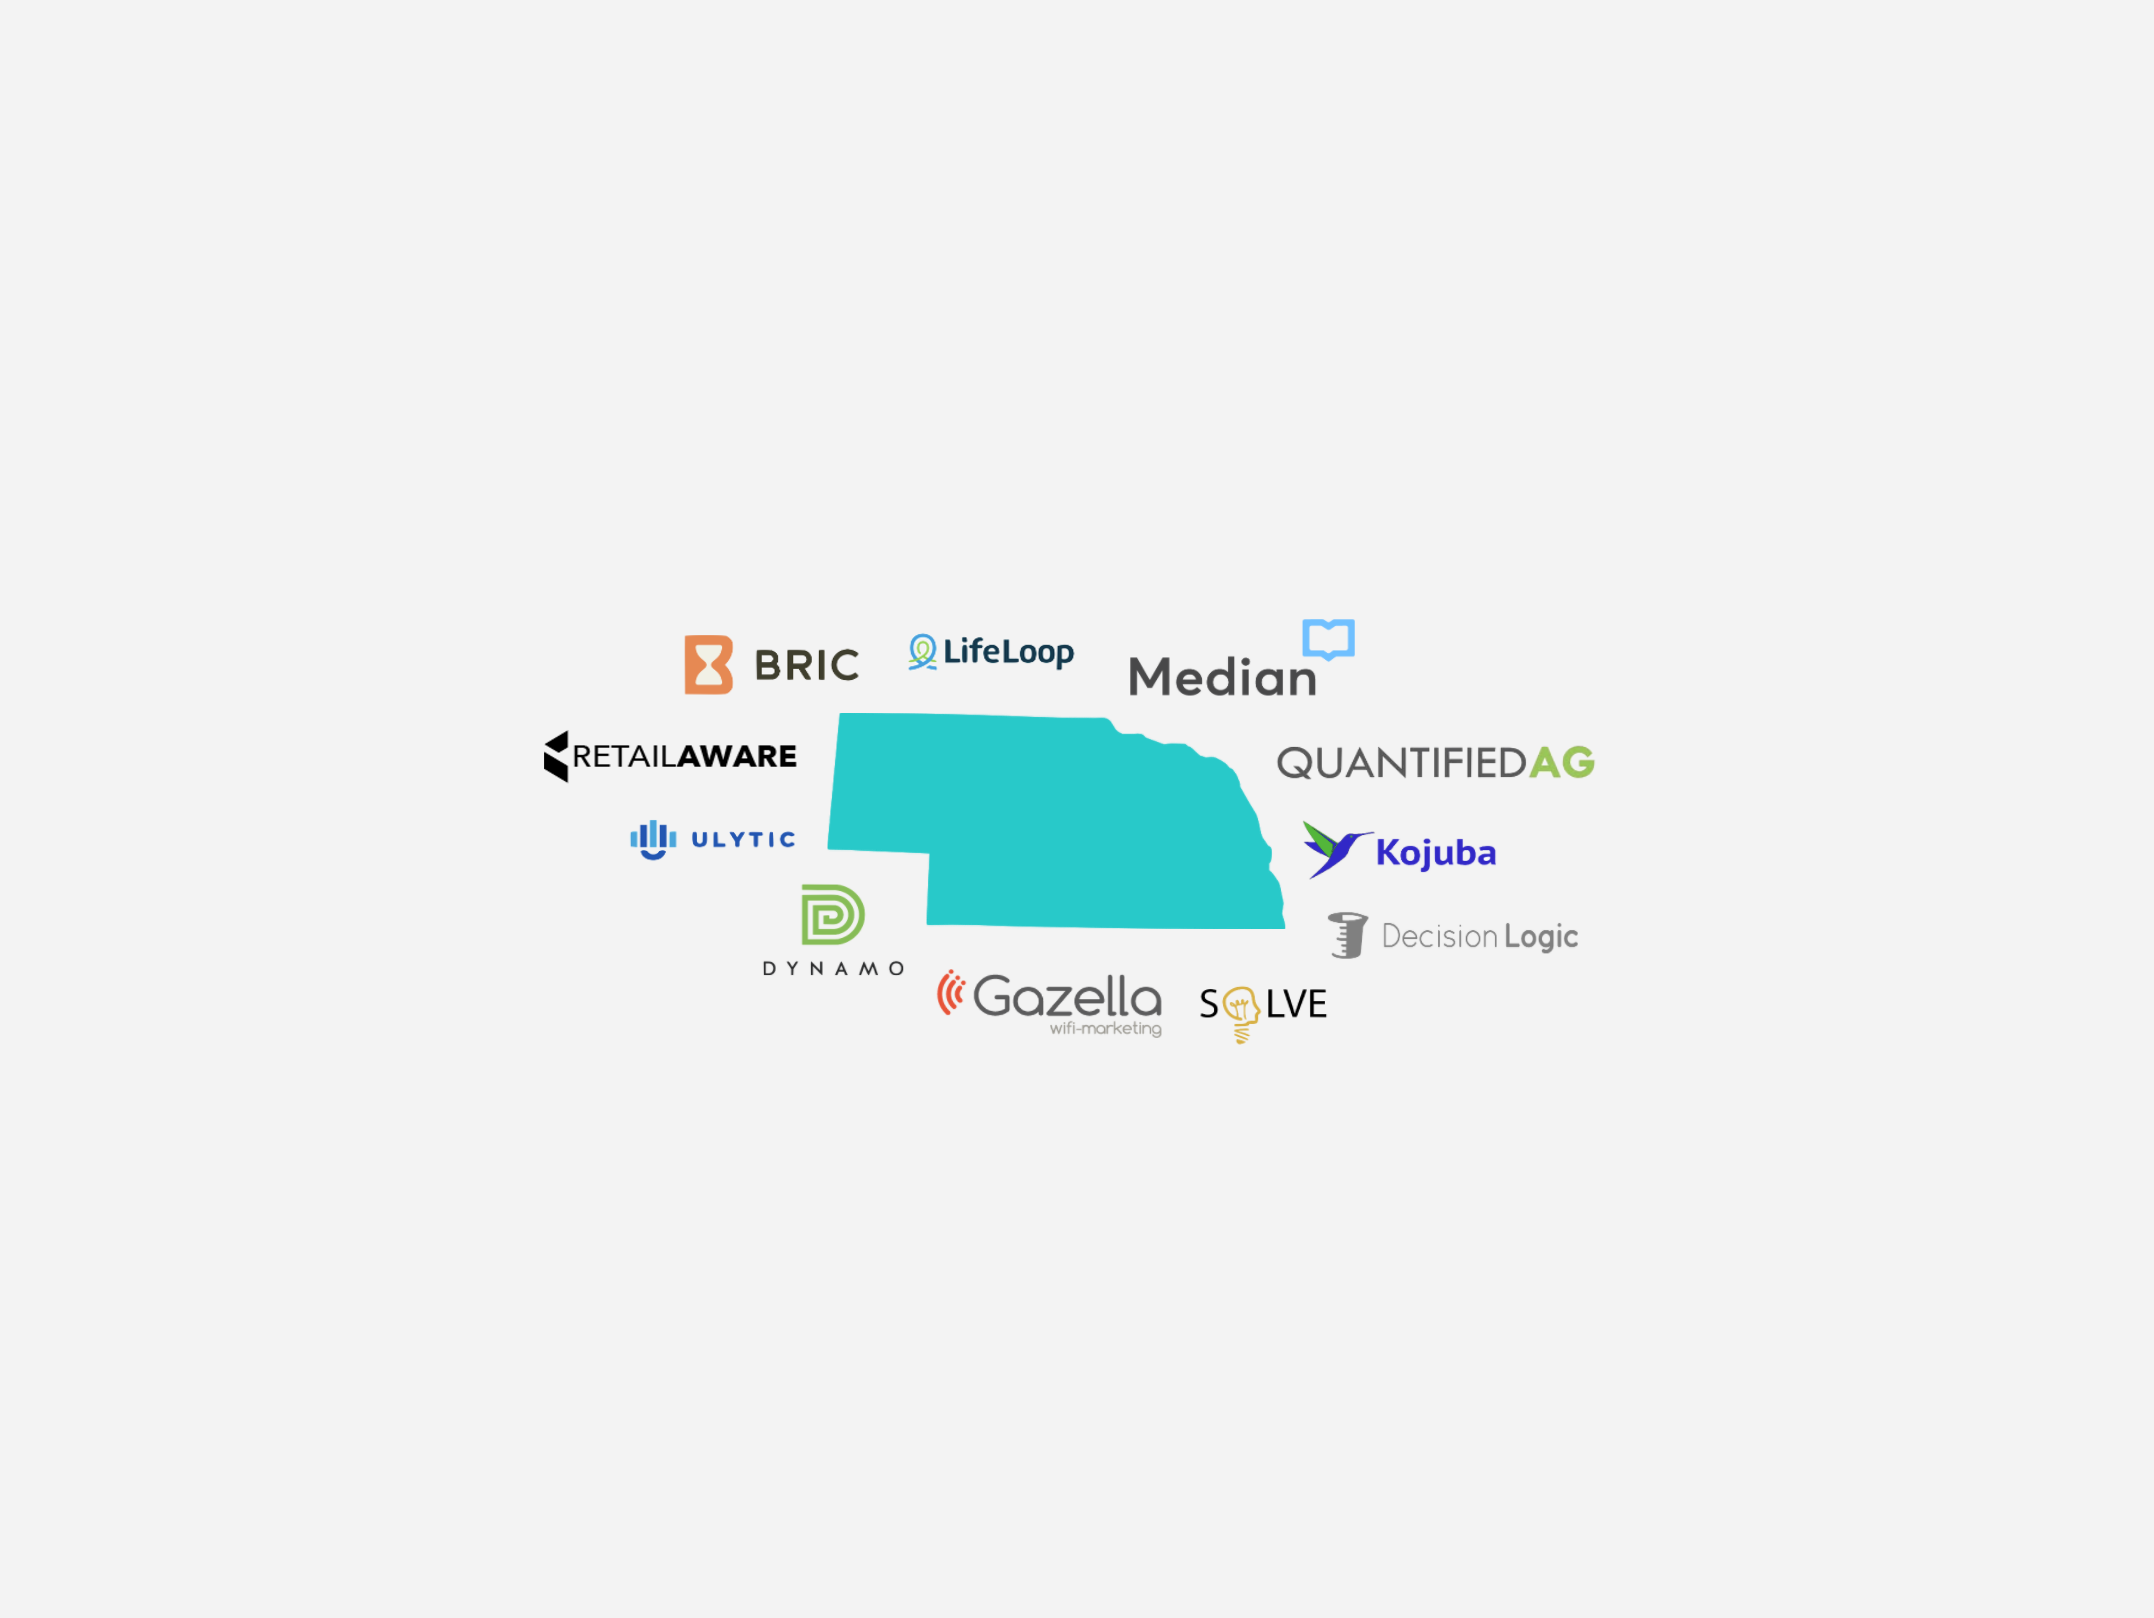
Nebraska is not California. Omaha is not San Francisco. This sounds glaringly obvious...
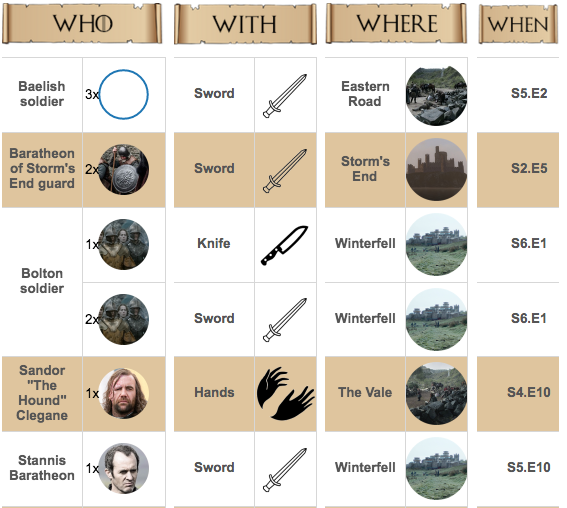
Sometimes obsession breads genius. Fans of Game of Thrones have dedicated much time to...
Our staff augmentation model proves that CAN believes in building a data analytics team...
Did you know CAN's blog is full of sound data science related advice dating back to the...
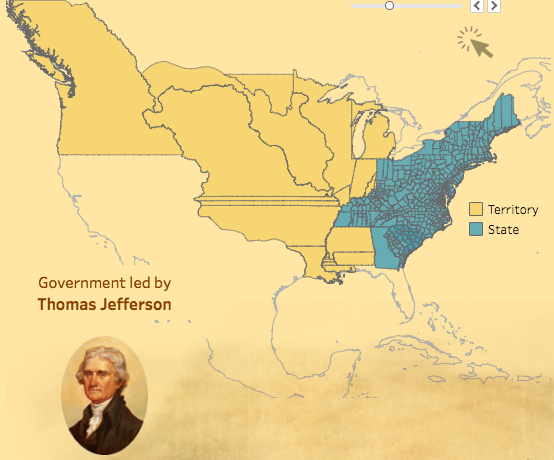
Cheers to happy and safe Fourth of July! For our celebration, we're sharing this Tableau...
The age-old Python or R debate always rages here at CAN. While we have a pretty...